Strategy Resources from Intrafocus
Lead and Lag IndicatorsWhat are leading and lagging indicators?
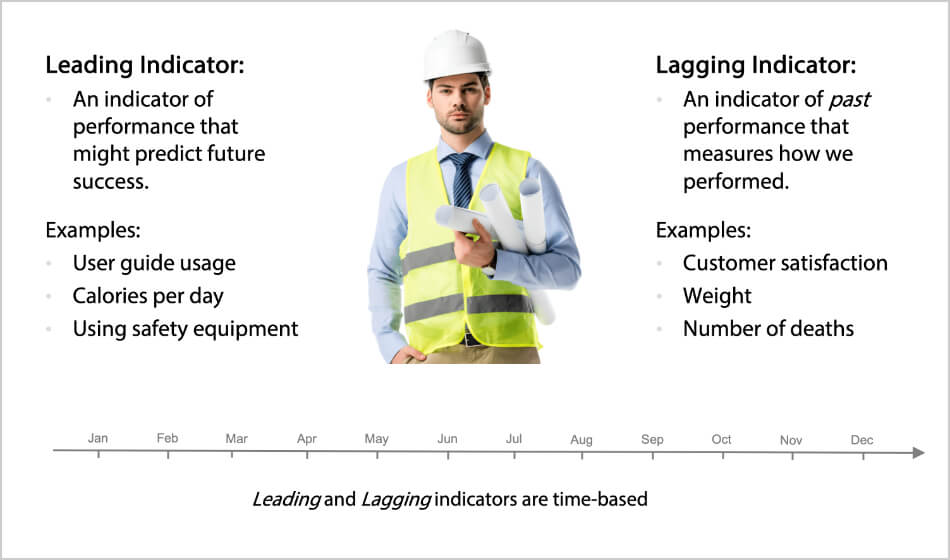
Leading and lagging indicators are two types of measurements used when assessing performance in a business or organisation. A leading indicator is a predictive measurement, for example; the percentage of people wearing hard hats on a building site is a leading safety indicator. A lagging indicator is an output measurement, for example; the number of accidents on a building site is a lagging safety indicator. The difference between the two is a leading indicator can influence change and a lagging indicator can only record what has happened.

All too often we concentrate on measuring results, outputs and outcomes. Why? Because they are easy to measure and they are accurate. If we want to know how many sales have been made this month, we simply count them. If we want to know how many accidents have occurred on the factory floor, we consult the accident log. These are lag indicators. They are an after-the-event measurement, essential for charting progress but useless when attempting to influence the future.
A different type of measurement is required to influence the future, one that is predictive rather than a result. For example, if we want to increase sales, a predictive measure could be to make more sales calls or run more marketing campaigns. If we wanted to decrease accidents on the factory floor, we could make safety training mandatory for all employees or force them to wear hard hats at all times. Measuring these activities provides us with a set of lead indicators. They are in-process measures and are predictive.
Lead indicators are always more challenging to determine than lag indicators. They are predictive and, therefore, do not guarantee success. This not only makes it difficult to decide which lead indicators to use, but it also tends to cause heated debate as to the validity of the measure at all. To fuel the debate further, lead indicators frequently require an investment to implement an initiative before a lag indicator sees a result.
What has become clear over years of research is that a combination of indicators results in enhanced business performance overall. To provide a couple of specific examples, “satisfied and motivated employees” is a (well-proven) lead Indicator of “customer satisfaction”. “High-performing processes” (e.g. to 6 Sigma levels) is a good lead indicator for “cost efficiency”. When developing a business performance management strategy, using a combination of lead and lag indicators is always good practice. The reason for this is obvious; a lag indicator without a lead indicator will not indicate how a result will be achieved and provide no early warnings about tracking towards a strategic goal.
Equally important, however, a lead indicator without a lag indicator may make you feel good about keeping busy with many activities. Still, it will not confirm that a business result has been achieved. Similarly, a Balanced Scorecard requires a ‘balance’ of measures across organisational disciplines, so a ‘balance’ of lead and lag indicators is required to ensure the suitable activities are in place to ensure the right outcomes.
There is a cause-and-effect chain between lead and lag indicators; both are important when selecting measures to track toward your business goals. Traditionally, we tend to settle for lag indicators; however, do not underestimate the importance of lead indicators.
Examples of Lead and Lag Indicators
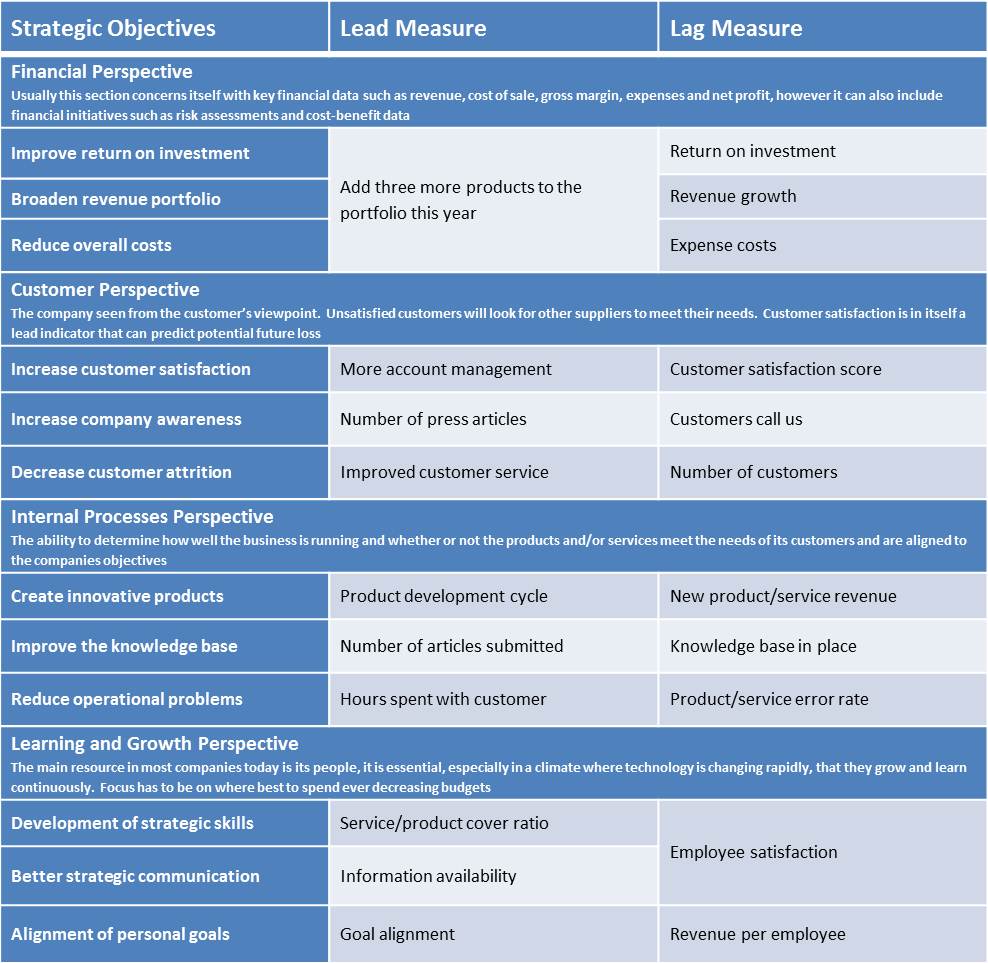
The following table provides some examples of lead and lag indicators used in producing a typical business scorecard.

KPI Software
Manage your Key Performance Indicators (KPIs) with Spider Impact, read more and take out a 30-day free trial.
More about Impact →
My5 KPIs mobile
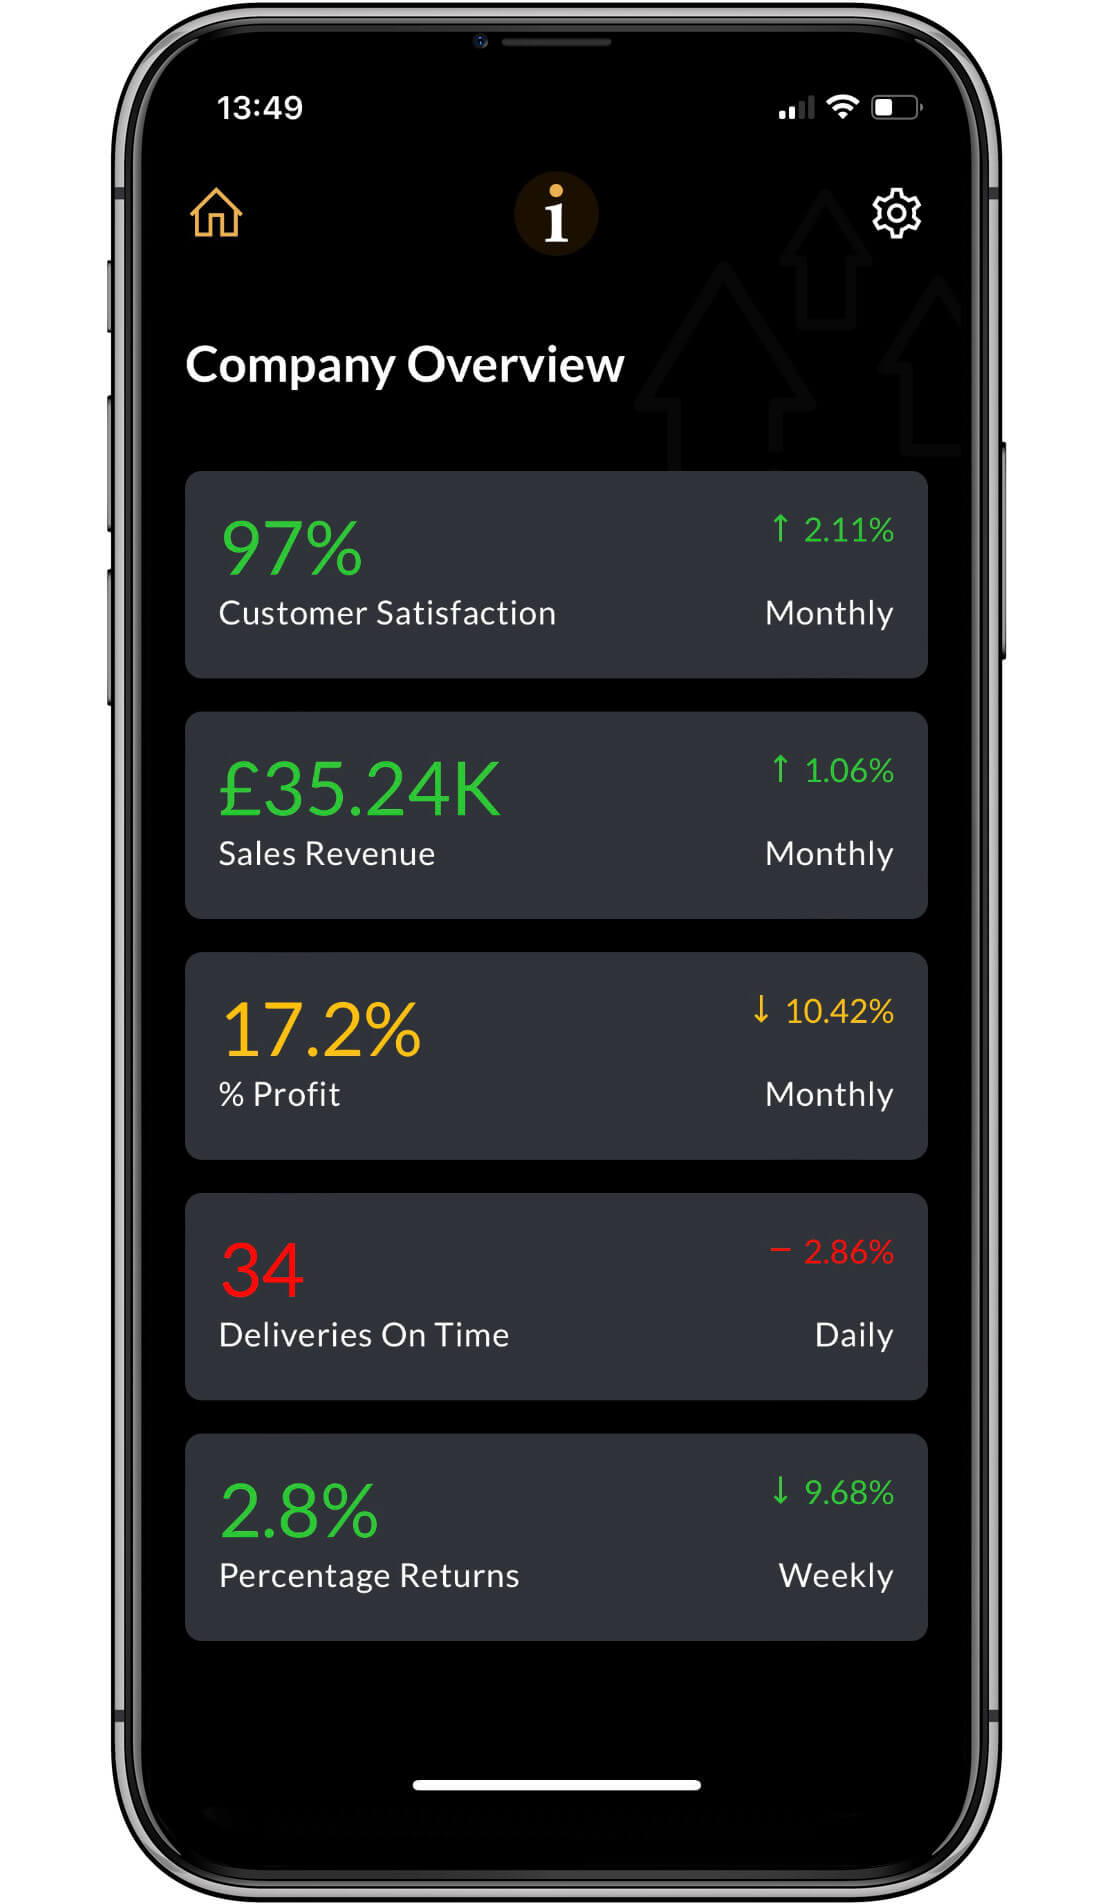
Use the My5 KPIs mobile app to keep track of your Key Performance Indicators
More about My5 KPIs →
Strategy Workshop
Learn about Lead and Lag measures and much more at one of our facilitated Strategy Workshops which we hold on your premises
Strategy Workshop →
BSP Training
Become a Balanced Scorecard Professional or just get an overview, whatever you need we have a training package for you.
BSP Training →
Download the pdf
Roland Schmid, Associate Director, Biogen Idec


