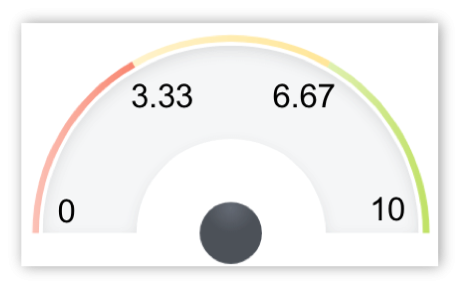
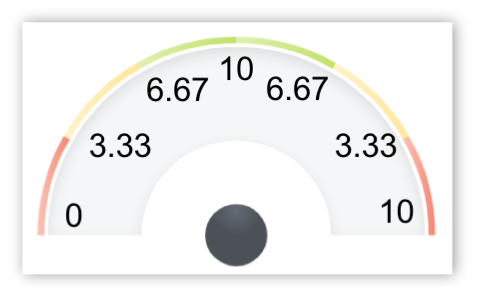
Scoring assigns a value between 0 and 10 to actual values based on a linear scale between user assigned thresholds for score changes. In each of the explanations below, the speedometer on the left is labelled with the score that will be calculated at the thresholds that the user sets when creating the Measure.
Note: Goal Red/Flag and Unscored are by far the most used scoring types
Goal/Red Flag
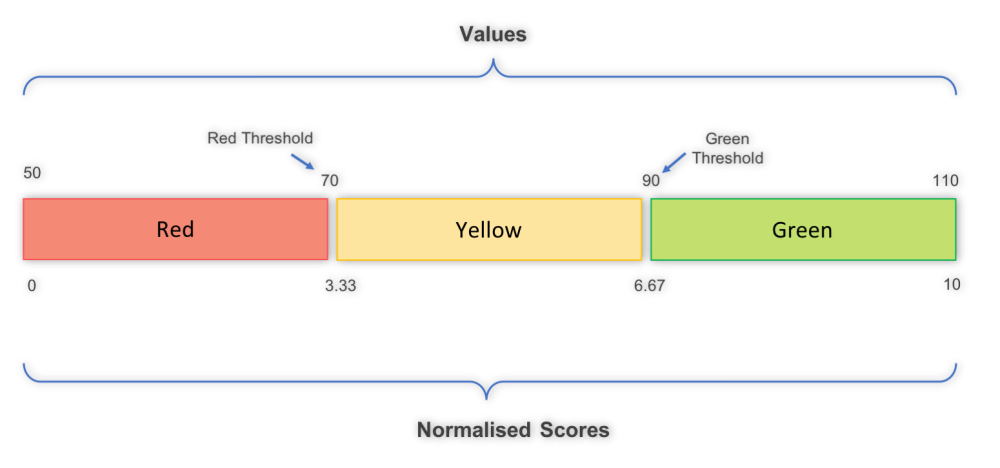
The user sets two threshold values for the breakpoint between yellow and red as well as the breakpoint between yellow and green. A score of 3.33 is assigned to the threshold between yellow and red. A Score of 6.67 is assigned to the threshold between yellow and green. The application takes the value of the difference between those two thresholds and adds that difference to those values to establish the threshold value for 0 and 10. The application determines the score for any actual value by calculating the linear relative position of the actual value to the thresholds/breakpoints bracketing it.
Unscored
No threshold values are set. This scoring type is often used to display targets or forecasts data or to collect data when a target is not known.

Yes/No
The user sets the scoring for whether yes is better or no is better. If yes is better than when the value is yes, the score is 10 and for no, the score is 0. If no is better than when the value is no, the score is 10 and for yes, the score is 0.
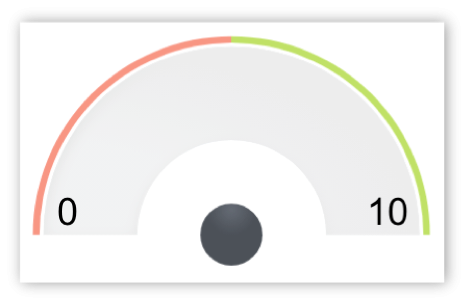
Goal Only
The user sets a value for the goal. The user sets the scoring for whether higher is better for the actual value relative to the goal. If higher is better, the score is 10 when the actual value is at goal or higher. If lower is better, the score is 10 when the actual value is at goal or lower.
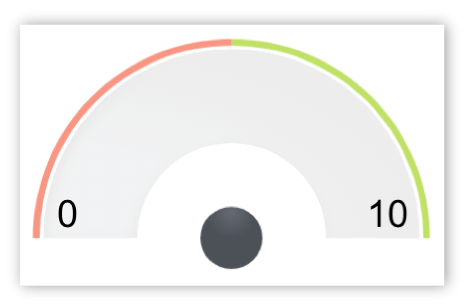
Two Colour
The user sets three threshold values for the end points and breakpoint between red and green on the speedometer. At the worst end point the score is 0, at the middle breakpoint the score is 5 and at the best breakpoint the score is 10. The application determines the score for any actual value by calculating the linear relative position of the actual value to the breakpoints/thresholds bracketing it.
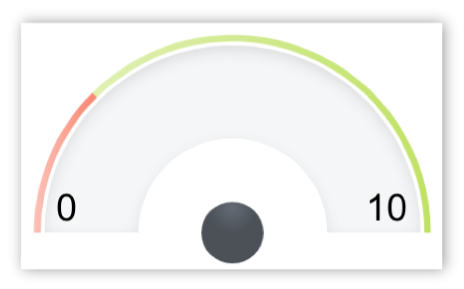
Three Colour
The user sets all four of the threshold values. This is identical to Goal/Red Flag except that the user sets the value for the 0 and 10 endpoints where the score is 0 and 10. The application determines the score for any actual value by calculating the linear relative position of the actual value to the thresholds bracketing it.
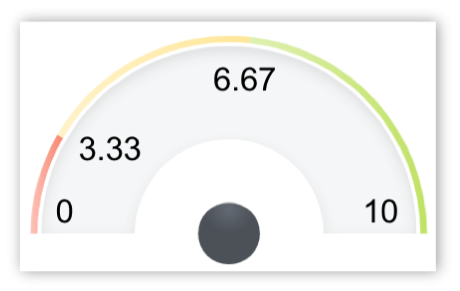
Four Colour Orange
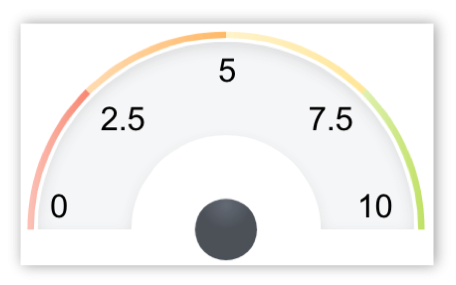
Once again, the threshold breakpoints and endpoint values are set by the user. The scores are again 0 and 10 at the end points. At the transition from red to orange, the score is 2.5. From orange to yellow, 5 and from yellow to green, 7.5. The application determines the score for any actual value by calculating the linear relative position of the actual value to the thresholds bracketing it.
Four Colour Blue
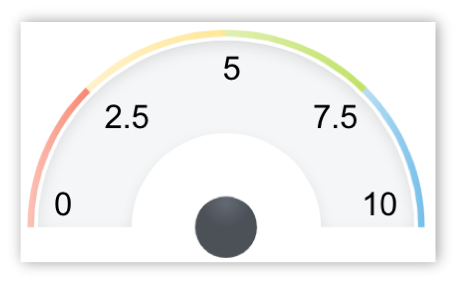
Four Colour Blue is identical to Four Colour Orange. Only the colours change between thresholds. The scores are again 0 and 10 at the end points. At the transition from red to yellow, the score is 2.5. From yellow to green, 5 and from green to blue, 7.5. The application determines the score for any actual value by calculating the linear relative position of the actual value to the thresholds bracketing it.
Four Colour Scored Middle
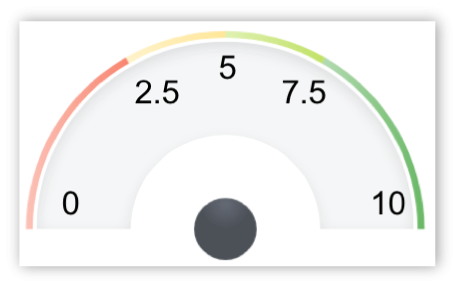
Once again, the threshold breakpoints are set by the user. In this case the end points are calculated by the application in the same way as for the Goal/Red Flag. At the transition from red to yellow, the score is 2.5. From yellow to green, 5 and from green to dark green, 7.5. The application determines the score for any actual value by calculating the linear relative position of the actual value to the thresholds bracketing it.
Two Colour Stabilize
Two Colour Stabilize establishes scores at thresholds for scores of 0 and 5 for values that are below a target value as well as 0 and 5 for values that are above a target value. The score is 10 at the target value threshold. The application determines the score for any actual value by calculating the linear relative position of the actual value to the thresholds bracketing it.
Three Colour Stabilize
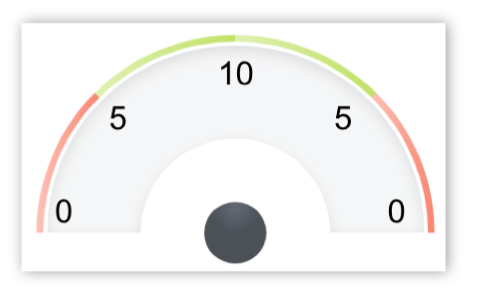
Three Colour Stabilize established scores at thresholds for scores of 0 and 3.33 and 6.67 for values that are below a target value as well as 0 and 3.33 and 6.67 for values that are above a target value. The score is 10 at the target value threshold. The application determines the score for any actual value by calculating the linear relative position of the actual value to the thresholds bracketing it.
Basic Scoring Methodology
- Measures form the basis for the scoring methodology
- Targets are set and then a score is calculated based upon where the actual values is relative to the target
- The Scores are then used in the calculation when roll-up scores to higher levels
- In this example we use Goal / Red Flag scoring
Rolling up scores
- The overall score of the superior scorecard object is determined by the weighed average of the specific scores of the subordinate scorecard objects.
- Factors that influence the overall score are: The score of the subordinate objects. The weight of each of the subordinate objects.
- For example, in determining your grade in an academic environment, rather than reporting multiple “A”s averaged to a 4.0 on the report card, your grade (score) will show a 96% on the report card.
Color roll up of objects
- The colour attributed to the object is based on the normalised score. In application administration, there is a choice for how non Measure objects will be scored: 2 colour, 3 colour, 4 colour orange or blue are the options. The score at the higher level relative to that choice will determine the colour at the higher level. For example in choosing 3 colour roll up scoring the colours will be
- Green – When the normalised score greater than or equal to > 6.67
- Amber – When the normalised score lies between 3.33 and 6.67
- Red – When the normalised score is less than or equal to < 3.33
- The average of the subordinate normalised scores will become the score of the next highest object or overarching strategy. (See the scoring explanation discussion for the values for other scoring types).
3 colour examples
Example 1:
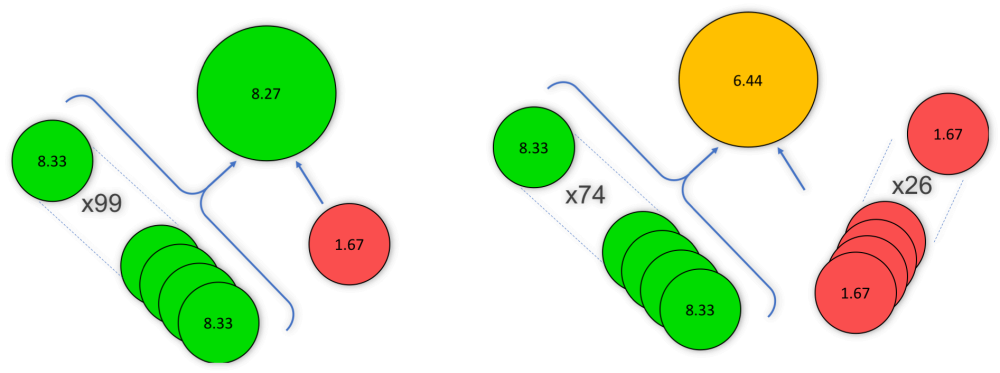
Where 99 subordinate objects have a score of 8.33 and 1 subordinate object has a score of 1.67 the object will have a score of 8.27
Example 2:
Where 74 subordinate objects have a score of 8.33 and 26 subordinate object has a score of 1.67 the object will have a score of 6.44
Effect of weight on roll up scoring
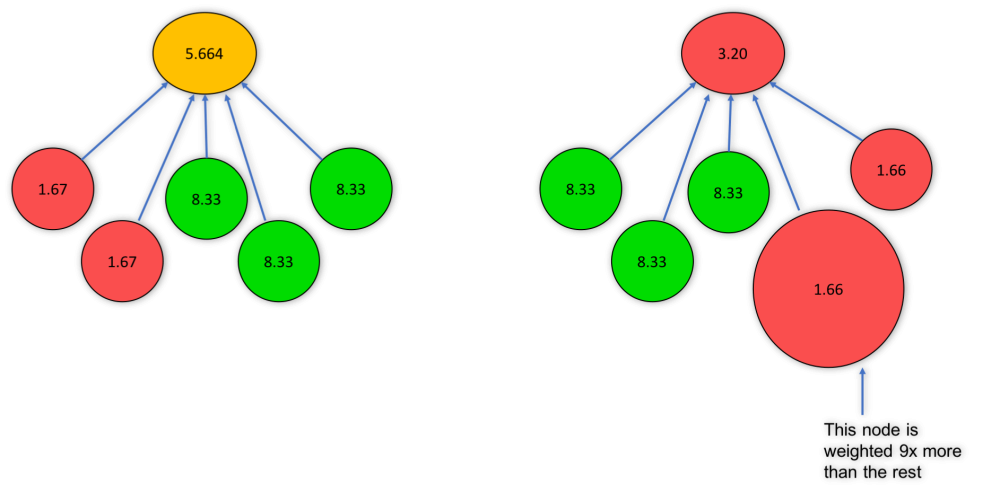
The mean score (after normalisation) of the subordinate objects is the score of the parent (example assumes equal weighting)
Same normalised scores but different outcome based on weighting

