Measures can be added at any level in a Scorecard. Measures are the ‘engine’ of the Scorecard. When you add actual values to Measures, a score is generated and the whole Scorecard will ‘colour-up’. To add Measures you need to be an Administrator.
Click on the Scorecard item under which you want the Measure to appear.
We have used the example item Improve Profit, and we will be adding the Measure ‘Profit’.
Click on the + New Scorecard Item button and the Create Measure dialogue will appear together with a New Measure under the Objective:
You do not have to provide all of the details at this stage, but there are a few things you will need to add.
Follow this sequence:
1. Give the Measure a name – this should be a label 3-5 words long.
2. Select the Type
3. Provide a description – this is optional but it is good practice to provide a description which includes where the Measure data can be found.
4. Select the Scoring Type – the scoring type can be one of eleven types. On most occasions, this will be Goal/Red Flag (Red/Amber/Green).
5. Select the Calendar – this relates to the frequency the data is collected, normally monthly for general management reporting.
6. Select the Data Type – the application can handle Currency, Percentage, Numeric and Yes/No data.
7. Select the Aggregation Type – this tells the application what to do with actual values when looking at them using a calendar other than the frequency collected calendar previously selected.
For example, for a Currency, the aggregation type is normally Sum. When looking at monthly data with a yearly calendar, you want the application to sum the months.
For a Percentage, the aggregation type is normally Average. When looking at monthly data using a yearly calendar, you want the application to take an average over the months.
Thresholds: You need to tell the application when you expect a Measure to turn red (from amber) and green (from amber):
8. Add the Red Flag threshold. For example, if the Measure is deemed to be Red below $25,000, the Red Flag value is $25,000.
9. Add the Green Flag threshold, this is usually the target.
10. Optionally add the Owner (this can be done later).
11. Optionally add the Updater (this can be done later).
Very Important: When you have entered all of the data click the blue Save button
You will be invited to add another Measure, a blank Create Measure screen will appear. Add as many Measures as you need. Click Cancel to stop the application from inviting you add more Measures.
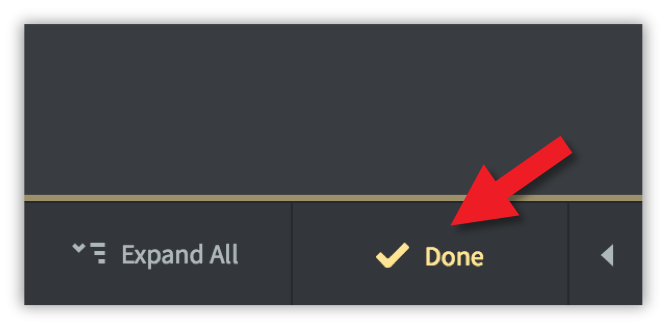
Once you have added all of your Measures, you can come out of Edit mode by clicking Done at the bottom of the menu list.

The resulting Scorecard and Measure might look something like this:
Measure Details
These parameters appear in the Measure Details and Series panels:
Scoring Type:
- Usually Goal/Red Flag, select from the list
Calendar:
- Monthly, Quarterly, Yearly, or a custom calendar type, e.g. company fiscal
Data Type: select from one of the three options:
- Number – numerical data, e.g. number of calls received
- Percentage – any percentage value, e.g. %Net Profit
- Currency – a number expressed in currency e.g. USD or GBP
Aggregation Type: How to aggregate for a different calendar view
- Sum – data added monthly will be summed up when viewed quarterly or yearly e.g. Revenue is usually defined as Sum
- Average – data that is added monthly will be averaged when viewed quarterly or yearly – e.g. %Net Profit is usually averaged
- Last Value – the last value added will be used when viewed quarterly or yearly – e.g. Cumulative Sales is usually set to Last Value
- Click here for a detailed description of Aggregation Type
Decimal Precision: The default can be set in Administration
- If you require anything other than the default, the decimal precision can be set here with a numerical value e.g. 0, 1, 2 etc.
Actual Value: Manual or Calculated
- It is possible to use a calculation, this is covered in advanced functions
Red Flag and Goal:
- When measures turn Red, Amber or Green
- The application bases all of its calculations on this setting. You need to determine when a performance measure is good, indifferent or bad, that is; Green, Amber or Red. For the Goal Red Flag measure this requires two values:
- Red Flag: when the performance measure turns Red
- Goal: when the performance measure turns Green


