Introduction
Cascading Scorecards within the application is a relatively simple procedure. However, it will only work successfully if a considered approach is taken before embarking on the process.
There are several ways a cascade can take place, here are a few examples:
- Exact Match Cascade (with auto roll-up)
A master Scorecard is created and an exact ‘structure’ replica is cascaded to teams within a department. Typical examples of this approach can be seen in call-centres when all of the team Measures are the same as the management Measures, or in a safety Scorecard where the same Scorecard is used across multiple departments. - Measure Calculated Roll Up Cascade (see the guide)
Targets are set at departmental levels (usually financial) and the values are rolled up to the top-level Scorecard. For example, a sales revenue target is set across several sales groups and the result is rolled up to a company level Scorecard. - Linked Element Scorecard (see the guide)
A Scorecard is created with all of the required Measures and appropriate Measures are linked into other Scorecards. For example, an executive incentive Scorecard that is distributed to a set of directors. The managing director will hold all of the Measures and they will be shared across the reporting directors. They might be weighted appropriately. - Strategy Scorecards (see the guide)
A top-level or executive Scorecard is created and some objectives are cascaded exactly and others are cascaded but the names change to reflect the departmental activity. For example, Improve Customer Satisfaction at the top-level might be translated to Improve Customer Information Responses by the Marketing department.
The application can be used with all of the scenarios above (and more) but again, it must be stressed, careful consideration needs to be given to the cascade before building the Scorecard.
The following provides information about Exact Match Cascade (with auto roll-up).
Exact Match Cascade
If you are cascading a set of Scorecards to several departments and the structure (not the actual values) is the same, then this method can be used.
First, build the master Scorecard. If you have not built Scorecards yet, see the Adding a Scorecard guide.
For this example we will create a group level Scorecard called Safety.
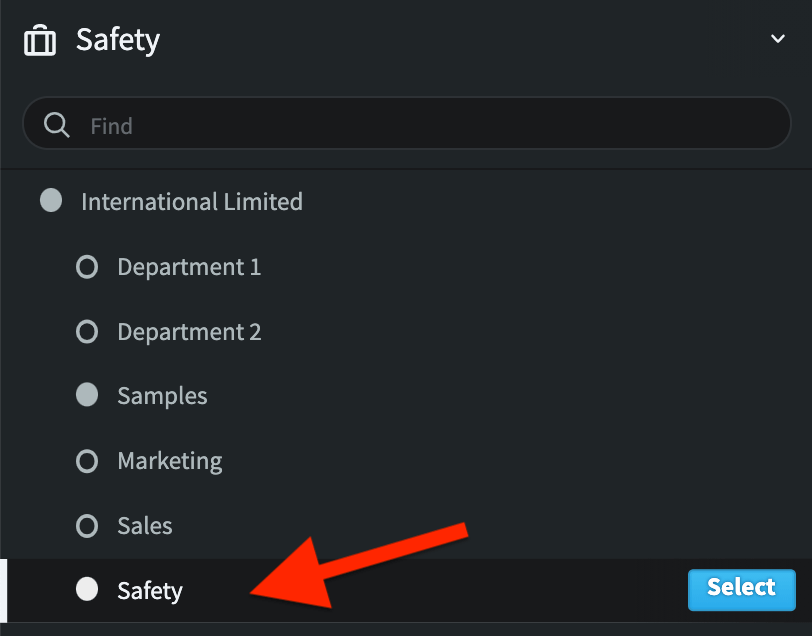
Begin by creating an Organization named Safety. You will see it appear in the Organization structure (click on the briefcase icon).
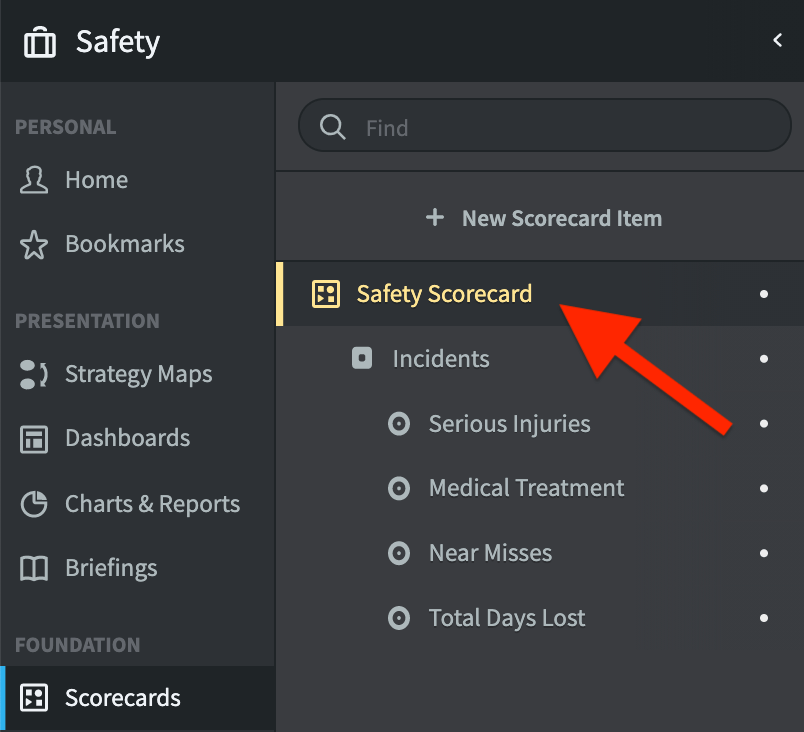
Once you have created the Safety organization, click on it and create the master Scorecard itself.
We have named it ‘Safety Scorecard’.
We have also included a number of relevent Measures etc.
Do not add any Actual Values or Thresholds at this time.
Next we will copy the master structure to the departments responsible for adding the actual values to the Scorecard. The organizational structure will be created automatically as part of the copy process.
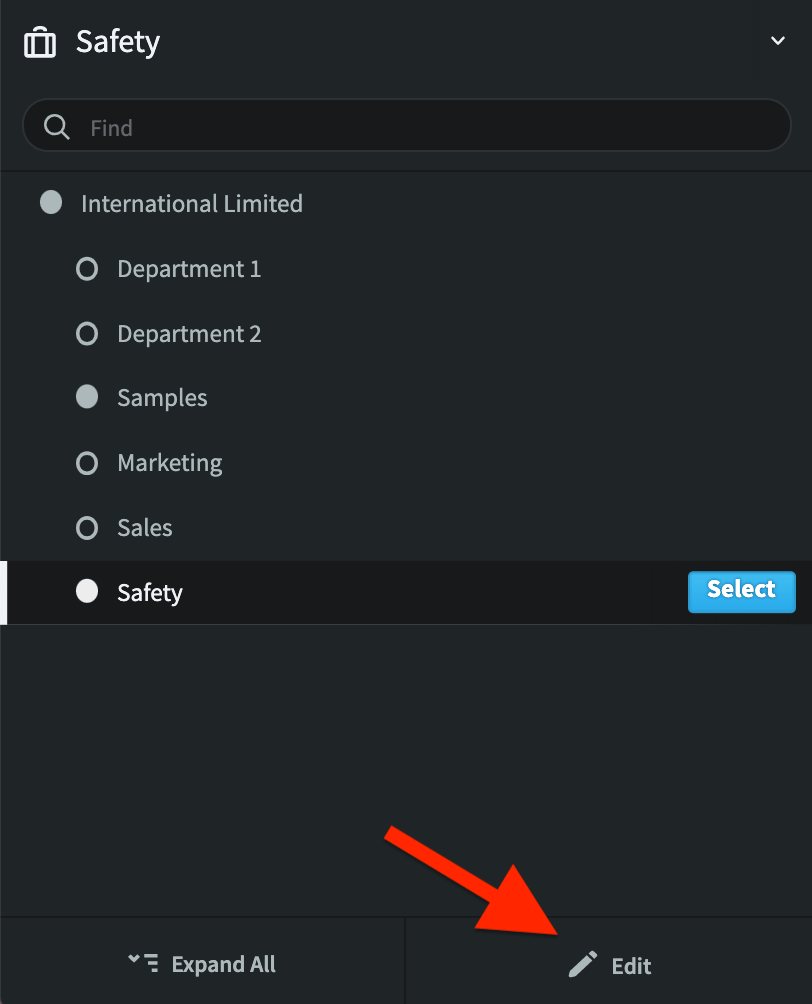
Click on the briefcase icon to reveal the organizational structure.
Highlight the top-level organizational object, in this case Safety.
Click on Edit at the bottom of the screen.
Another menu will appear. Click on Copy as Template.
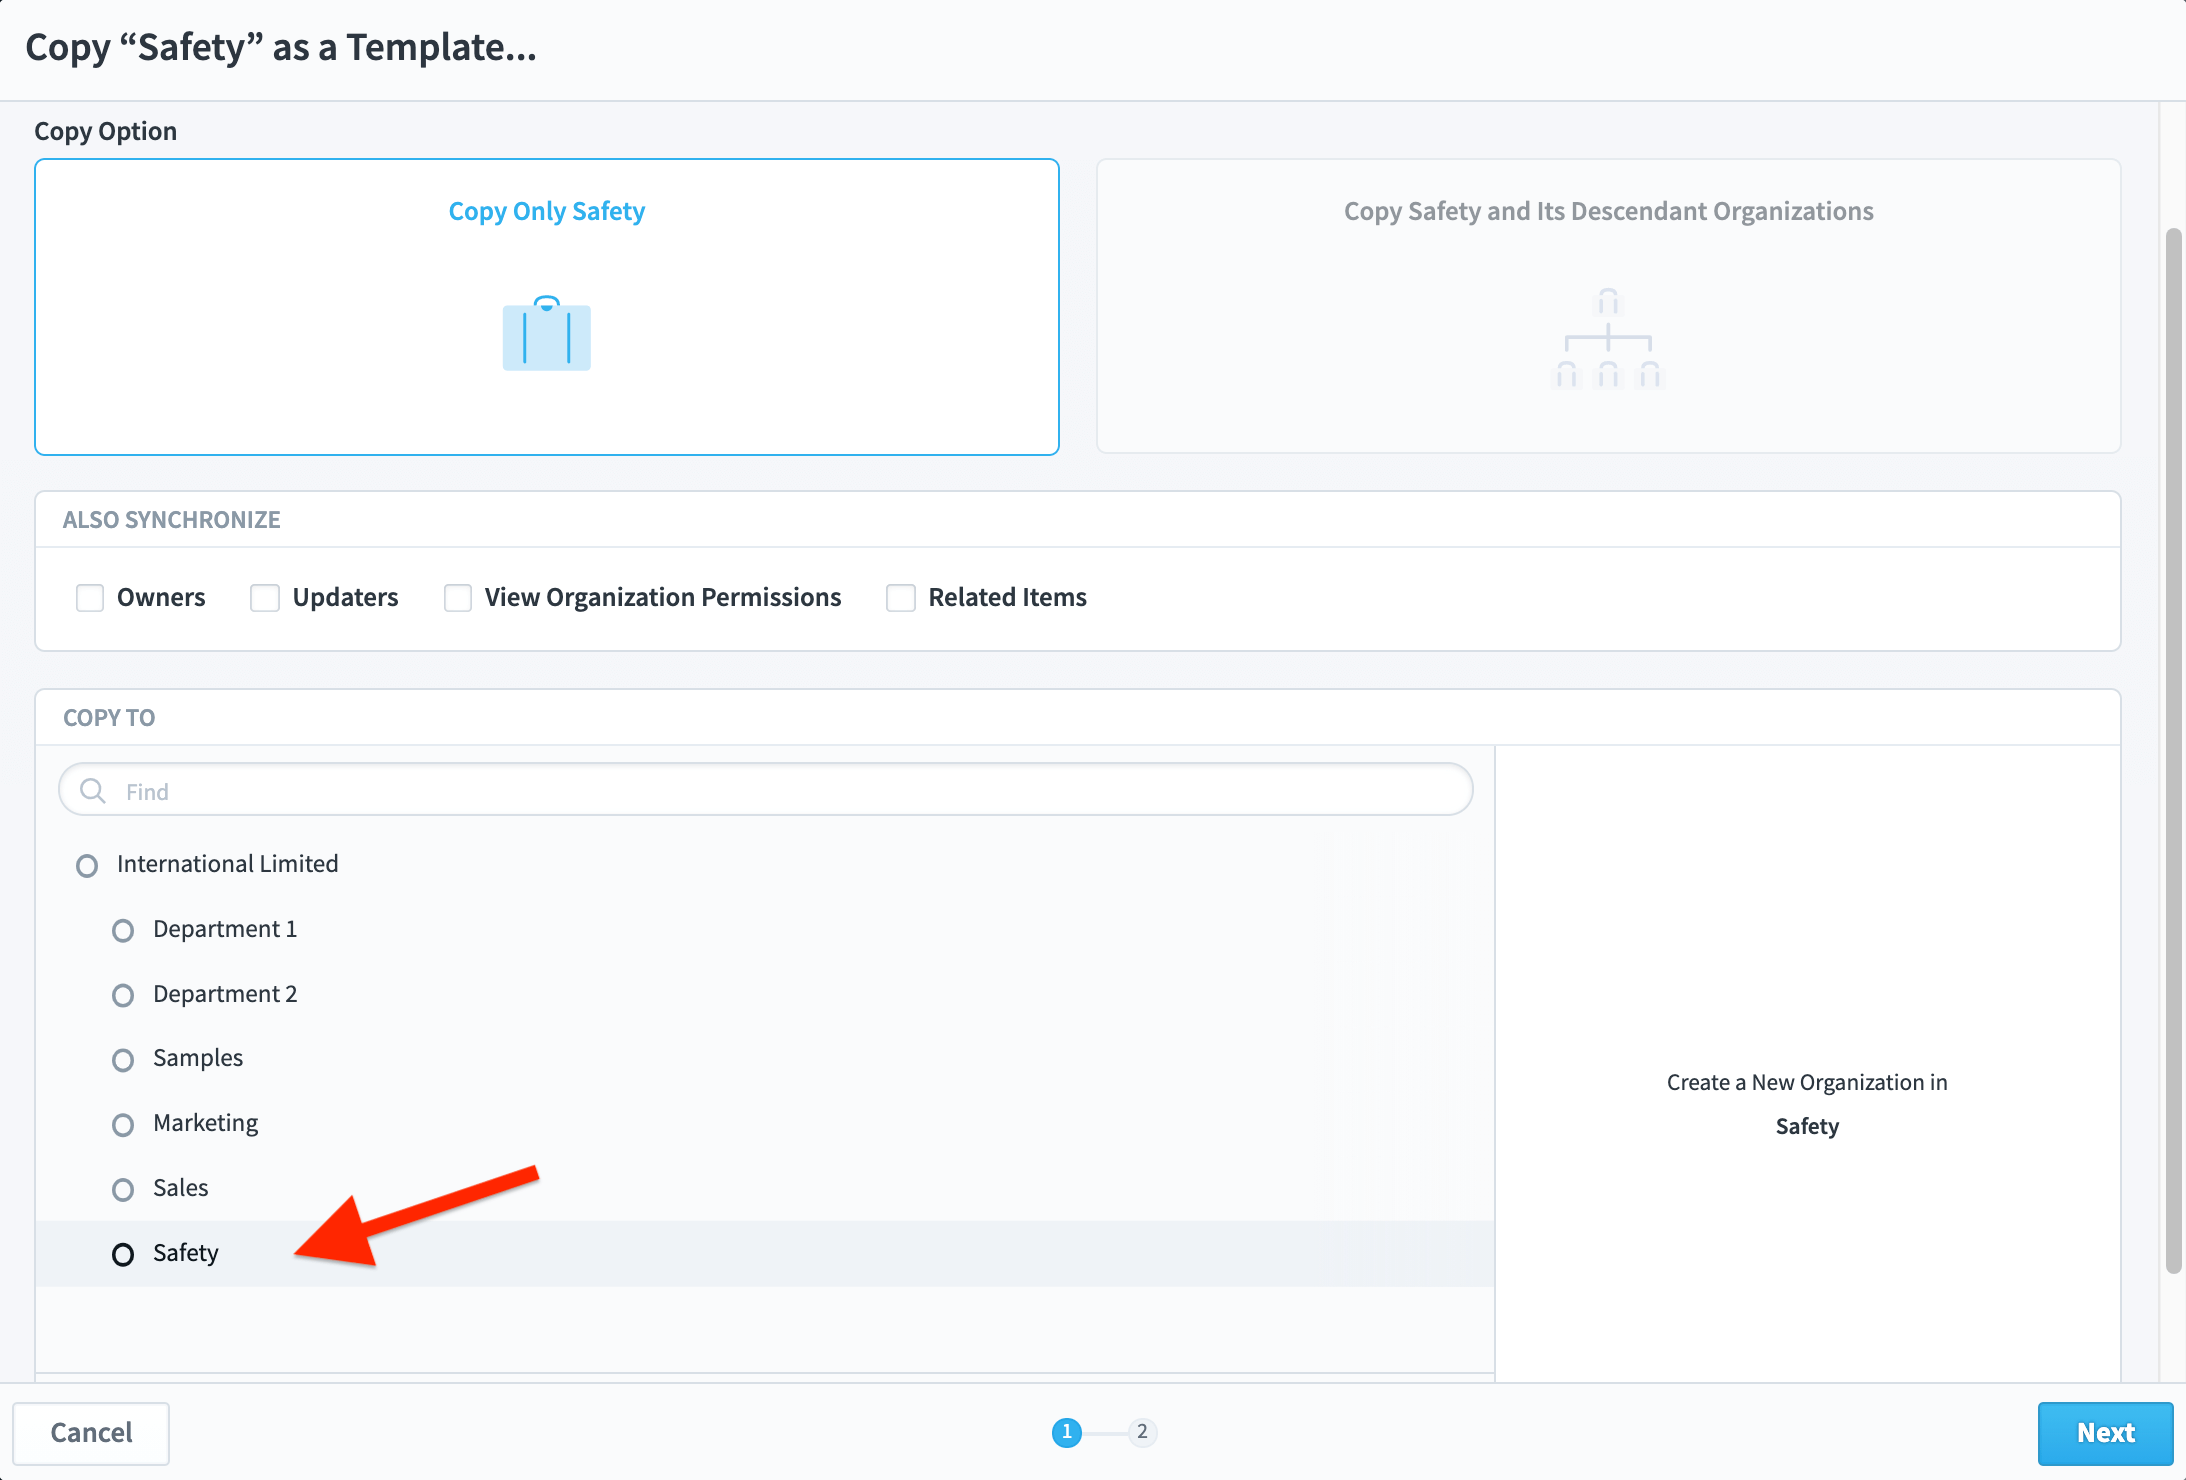
A panel will appear asking where to make the copy. Select the top-level Scorecard you have previously created (in this case ‘Safety’), and click Continue:
At this point you can name the new cascaded organizational object and optionally provide a unique suffix or prefix for the Scorecards, Dashboards and Reports that you will go on to create.
In the example shown on the next page you will see that we have created a new sub-organizational object called Safety – London and we have added the suffix ‘ – London’ to the Scorecards, Dashboards and Reports.
It is good practice to add a suffix or prefix as this helps considerably at later stages when looking at measures that have the same name.
Our example looks like this:
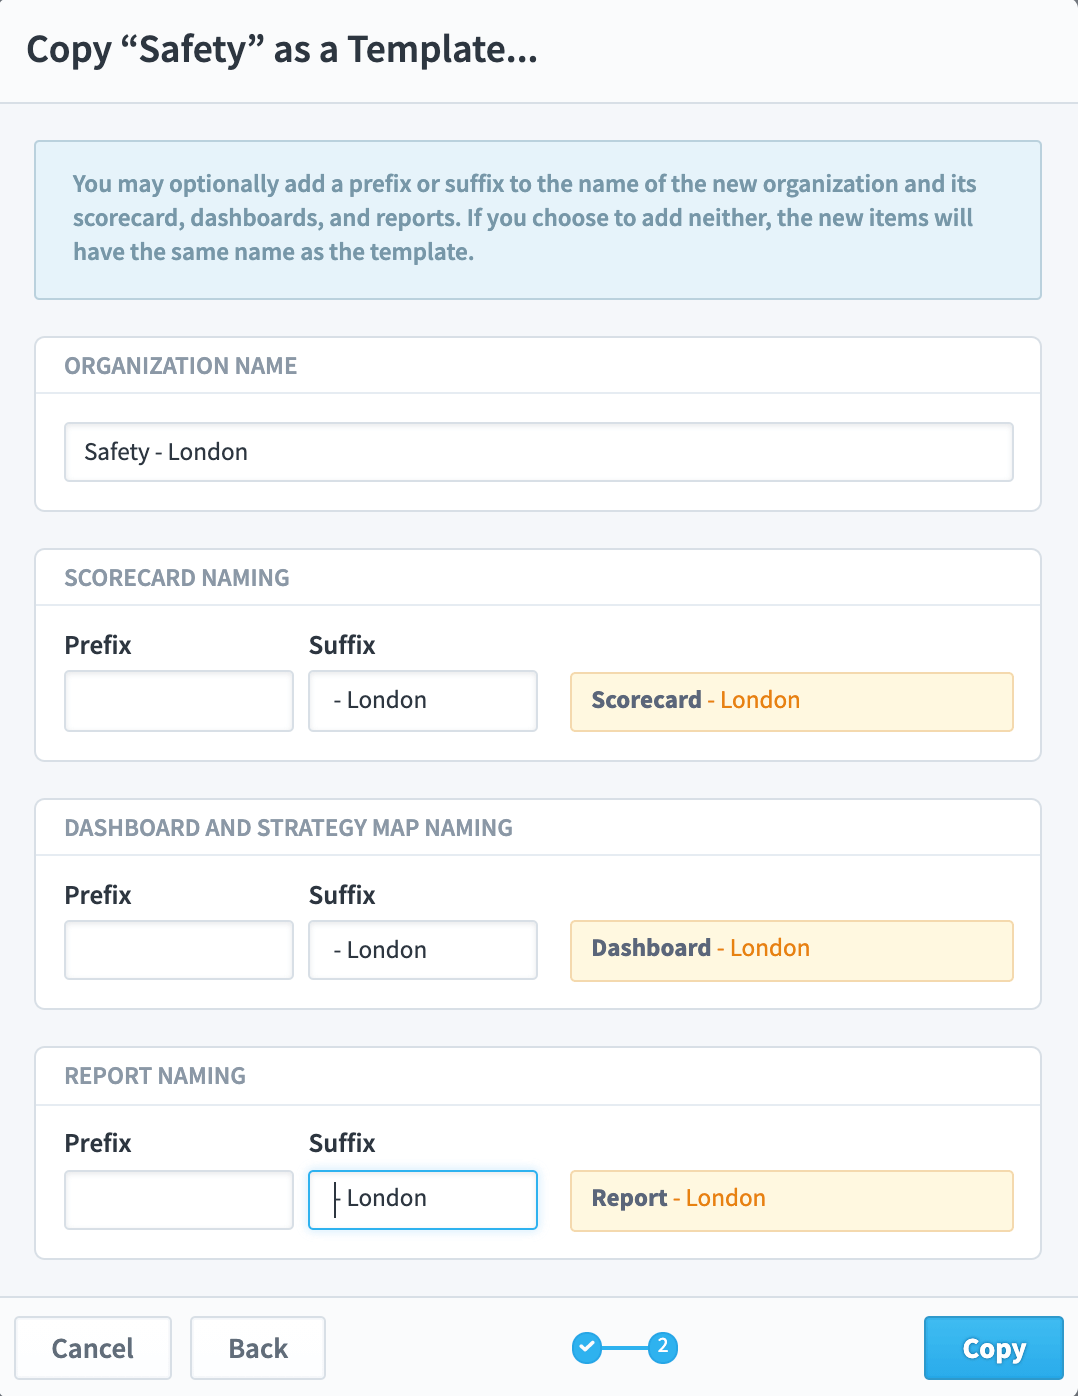
Click Copy to save the cascaded Scorecard.
Click Done at the bottom of the screen.
You may have to refresh the browser screen to see the newly added cascaded Scorecard.
In our example, we have gone on to add two more ‘copied’ Scorecards for the regions of Madrid and Vienna.
Just repeat the process above for as many cascaded Scorecards that you require.
As can be seen in our example, the three new objects have been created.
Select one of them and look at the Scorecard.
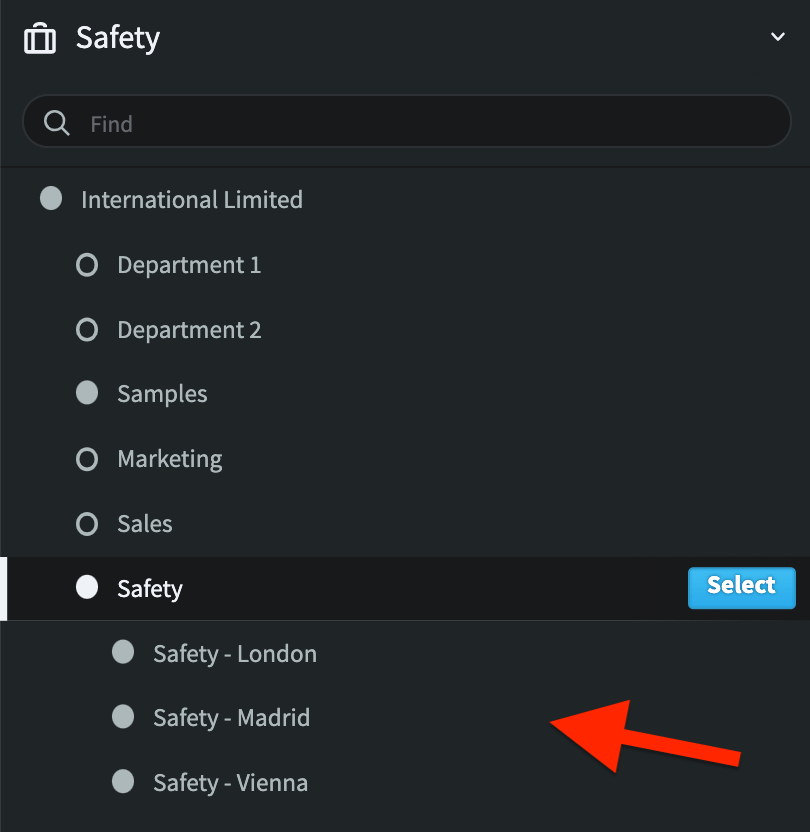
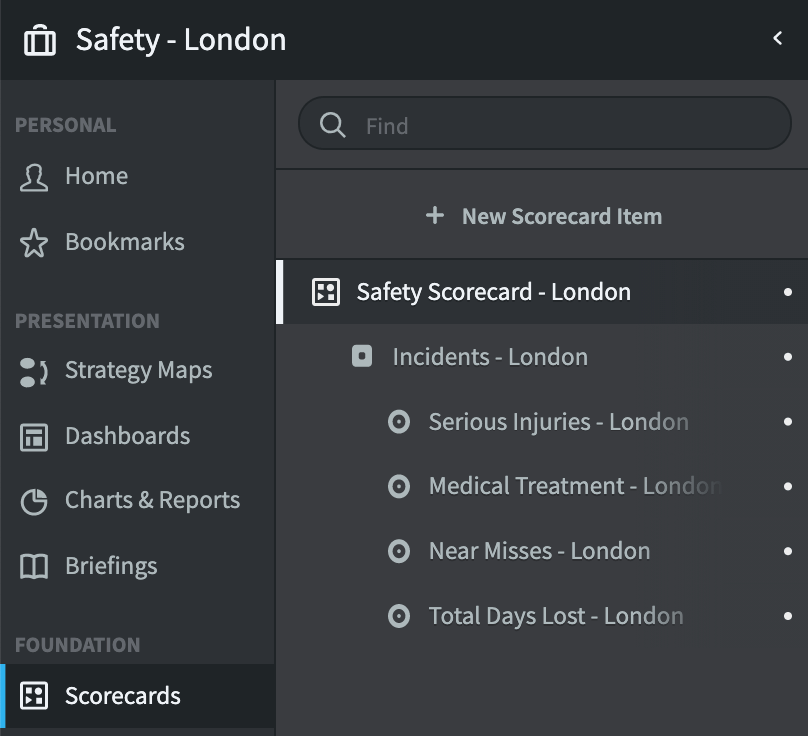
We have selected ‘Safety – London’.
If you have completed the process correctly, you will see that the suffix has been appended to not only the Scorecard, but to the Perspective and each of the Measures.
From this point onward, any changes to the Scorecard must be made in the Master. These will be reflected in the lower-level Scorecards. If you attempt to change an object in a lower-level Scorecard you will receive the following message:

To enable automated roll-up you need to go back to the master Scorecard.
Click on the Briefcase icon and select the master Scorecard organisation.
In our example we have selected Safety.
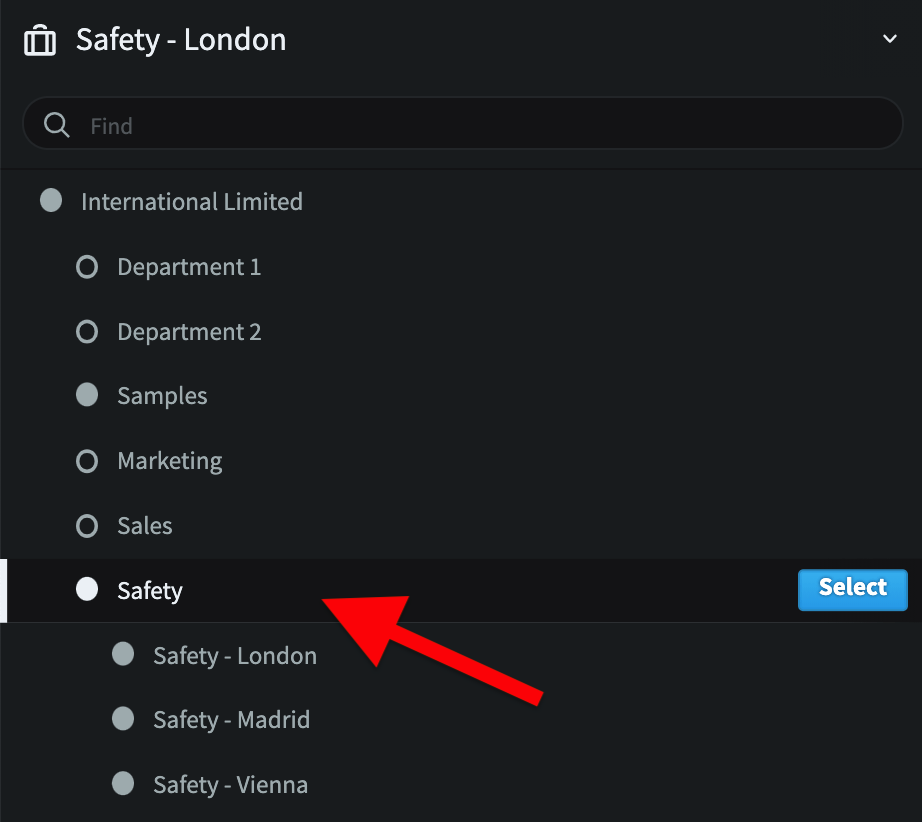
Go to the Scorecard view and select the first Measure. Depending on the Measure Data Type and exactly what you are trying to achieve, the next actions can be varied but will follow a similar process.
We will provide two examples:
- Actual Values and Thresholds rolled up from lower levels. For example, Number of Serious Injuries, where the targets are set locally.
- Actual Values as a calculation and Thresholds set at the master level. For example, a Safety Incident Ratio (a percentage).
1. Actual Values and Thresholds rolled up from lower level
Go to the master Scorecard and click on the Measure. In this example we are using Serious Injuries.
Click on Edit at the top right of the screen.
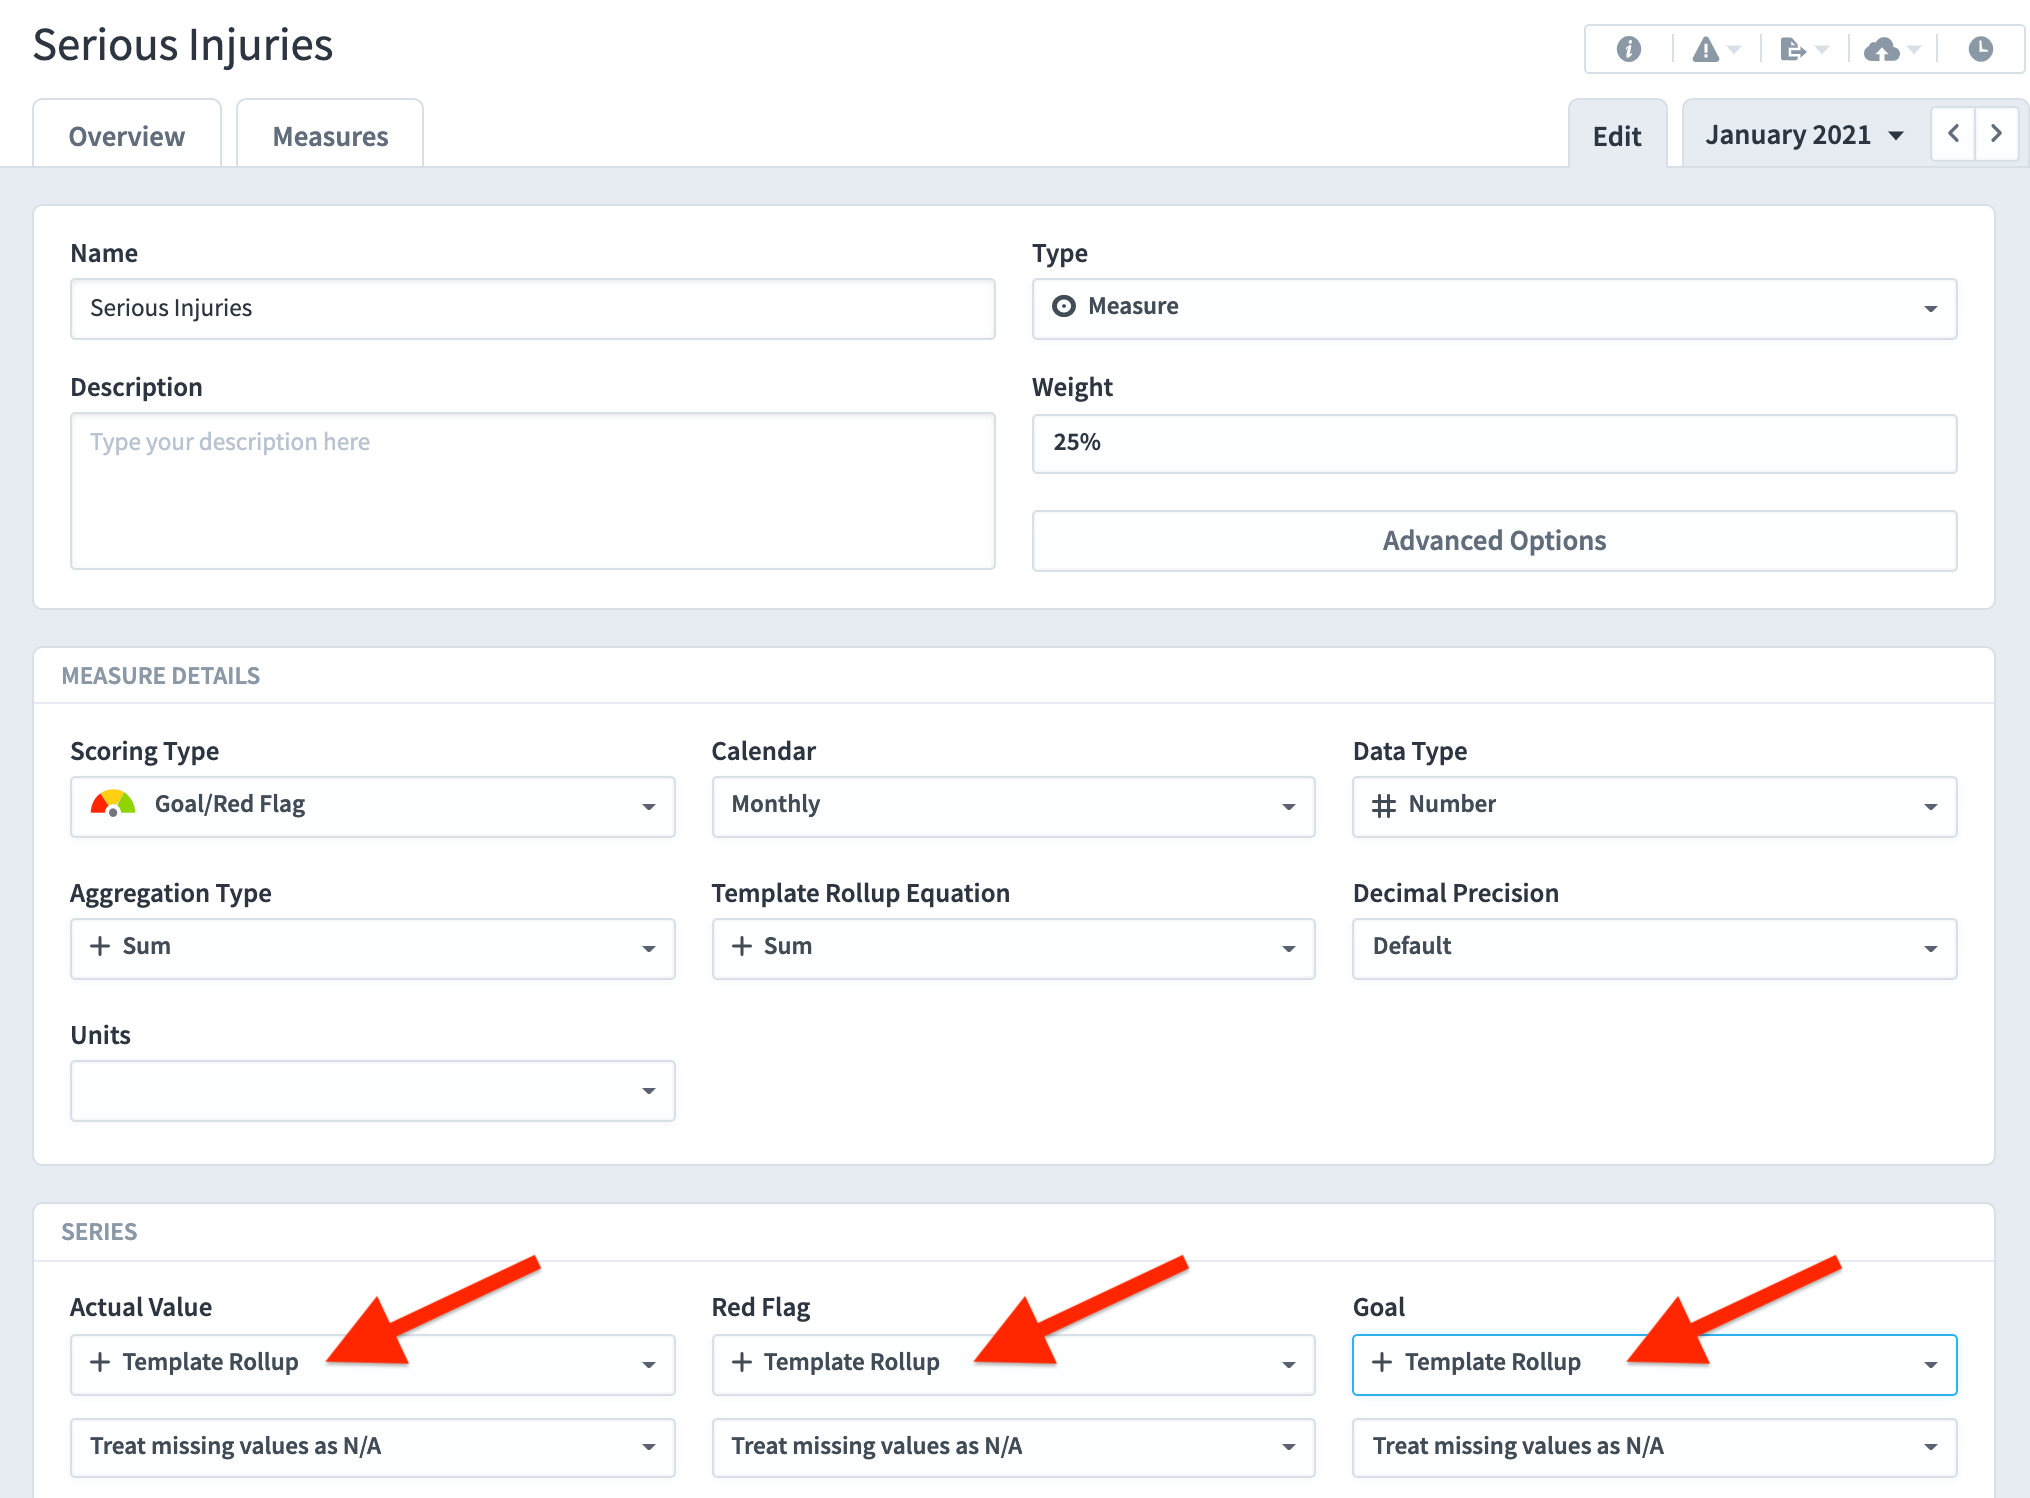
In the Series box under Actual Value, Red Flag, and Goal, select + Template Rollup from each box.
Click Save.
The application will now expect the Actual Values, Red Flags and Goals to be set at the lower levels (in our example in Safety-London, Safety-Madrid and Safety-Vienna).
Go to the lower level organisation and Scorecard.
We will start with Safety-London (the same steps will need to be taken at all lower levels). Select a Measure and click on the Edit tab.
The following message will appear:
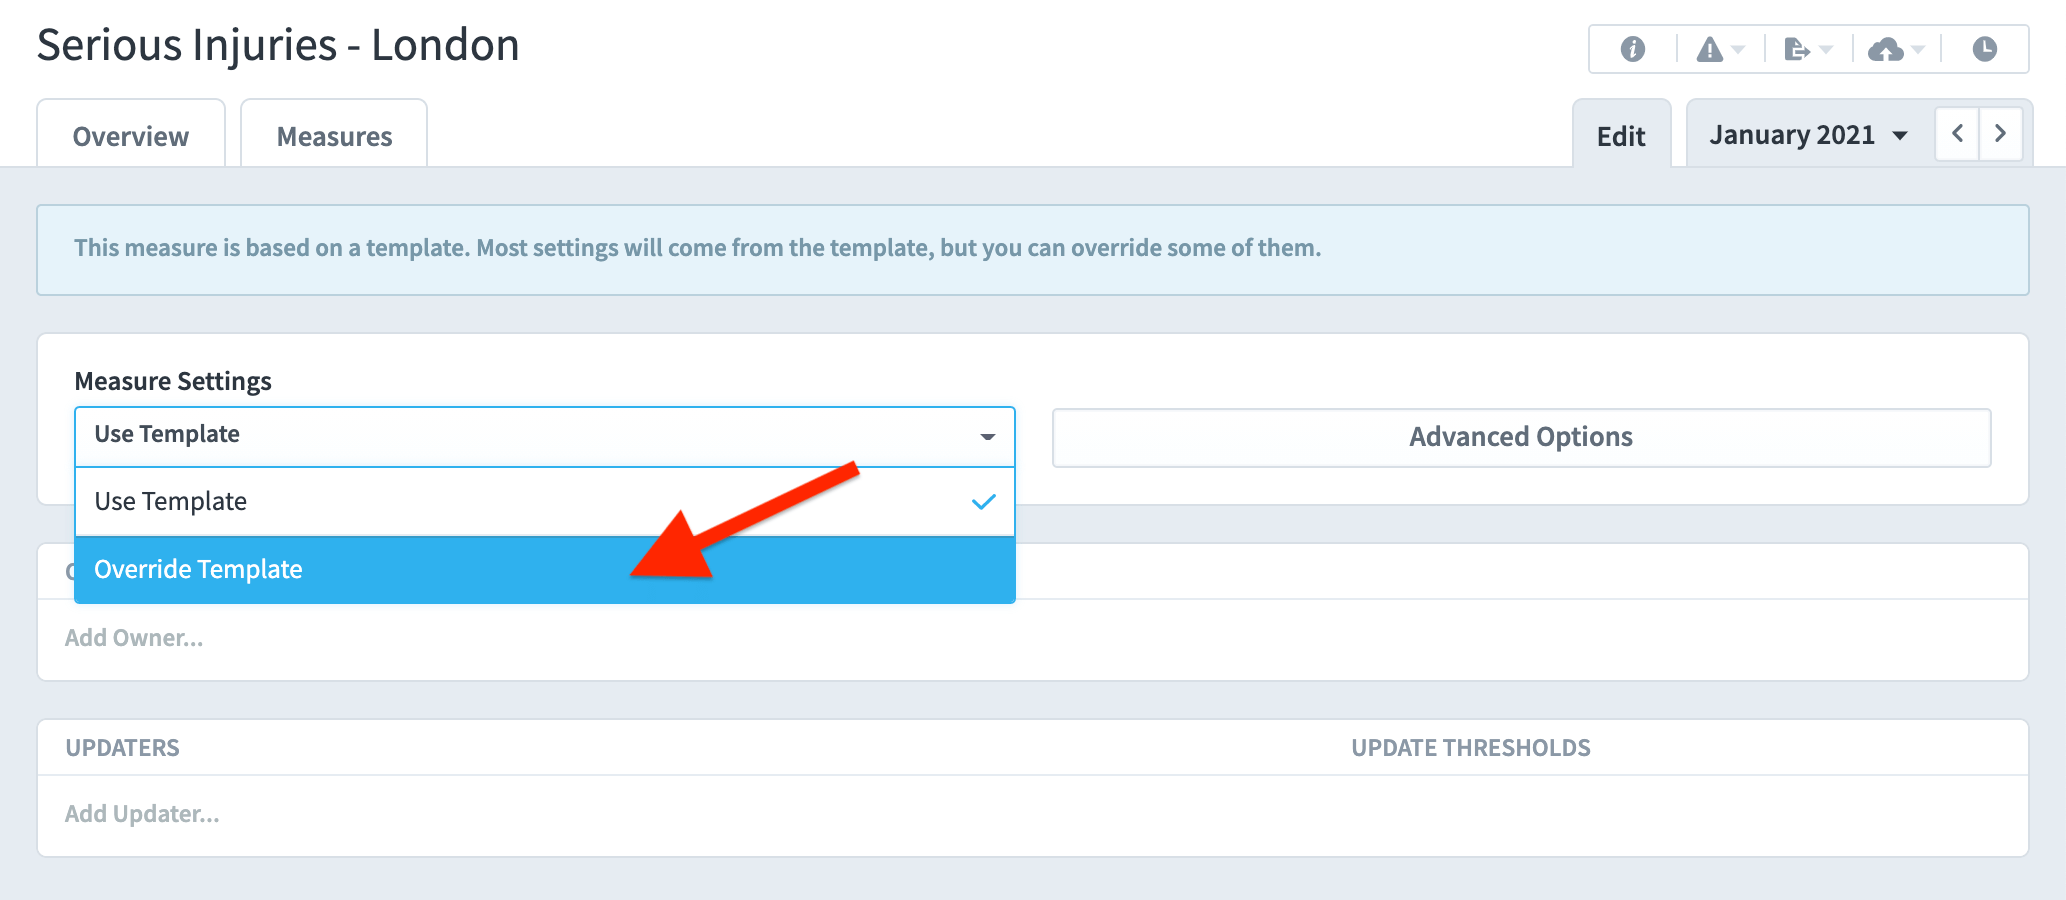
Click on the Measure Settings drop-down list and select Override Template.
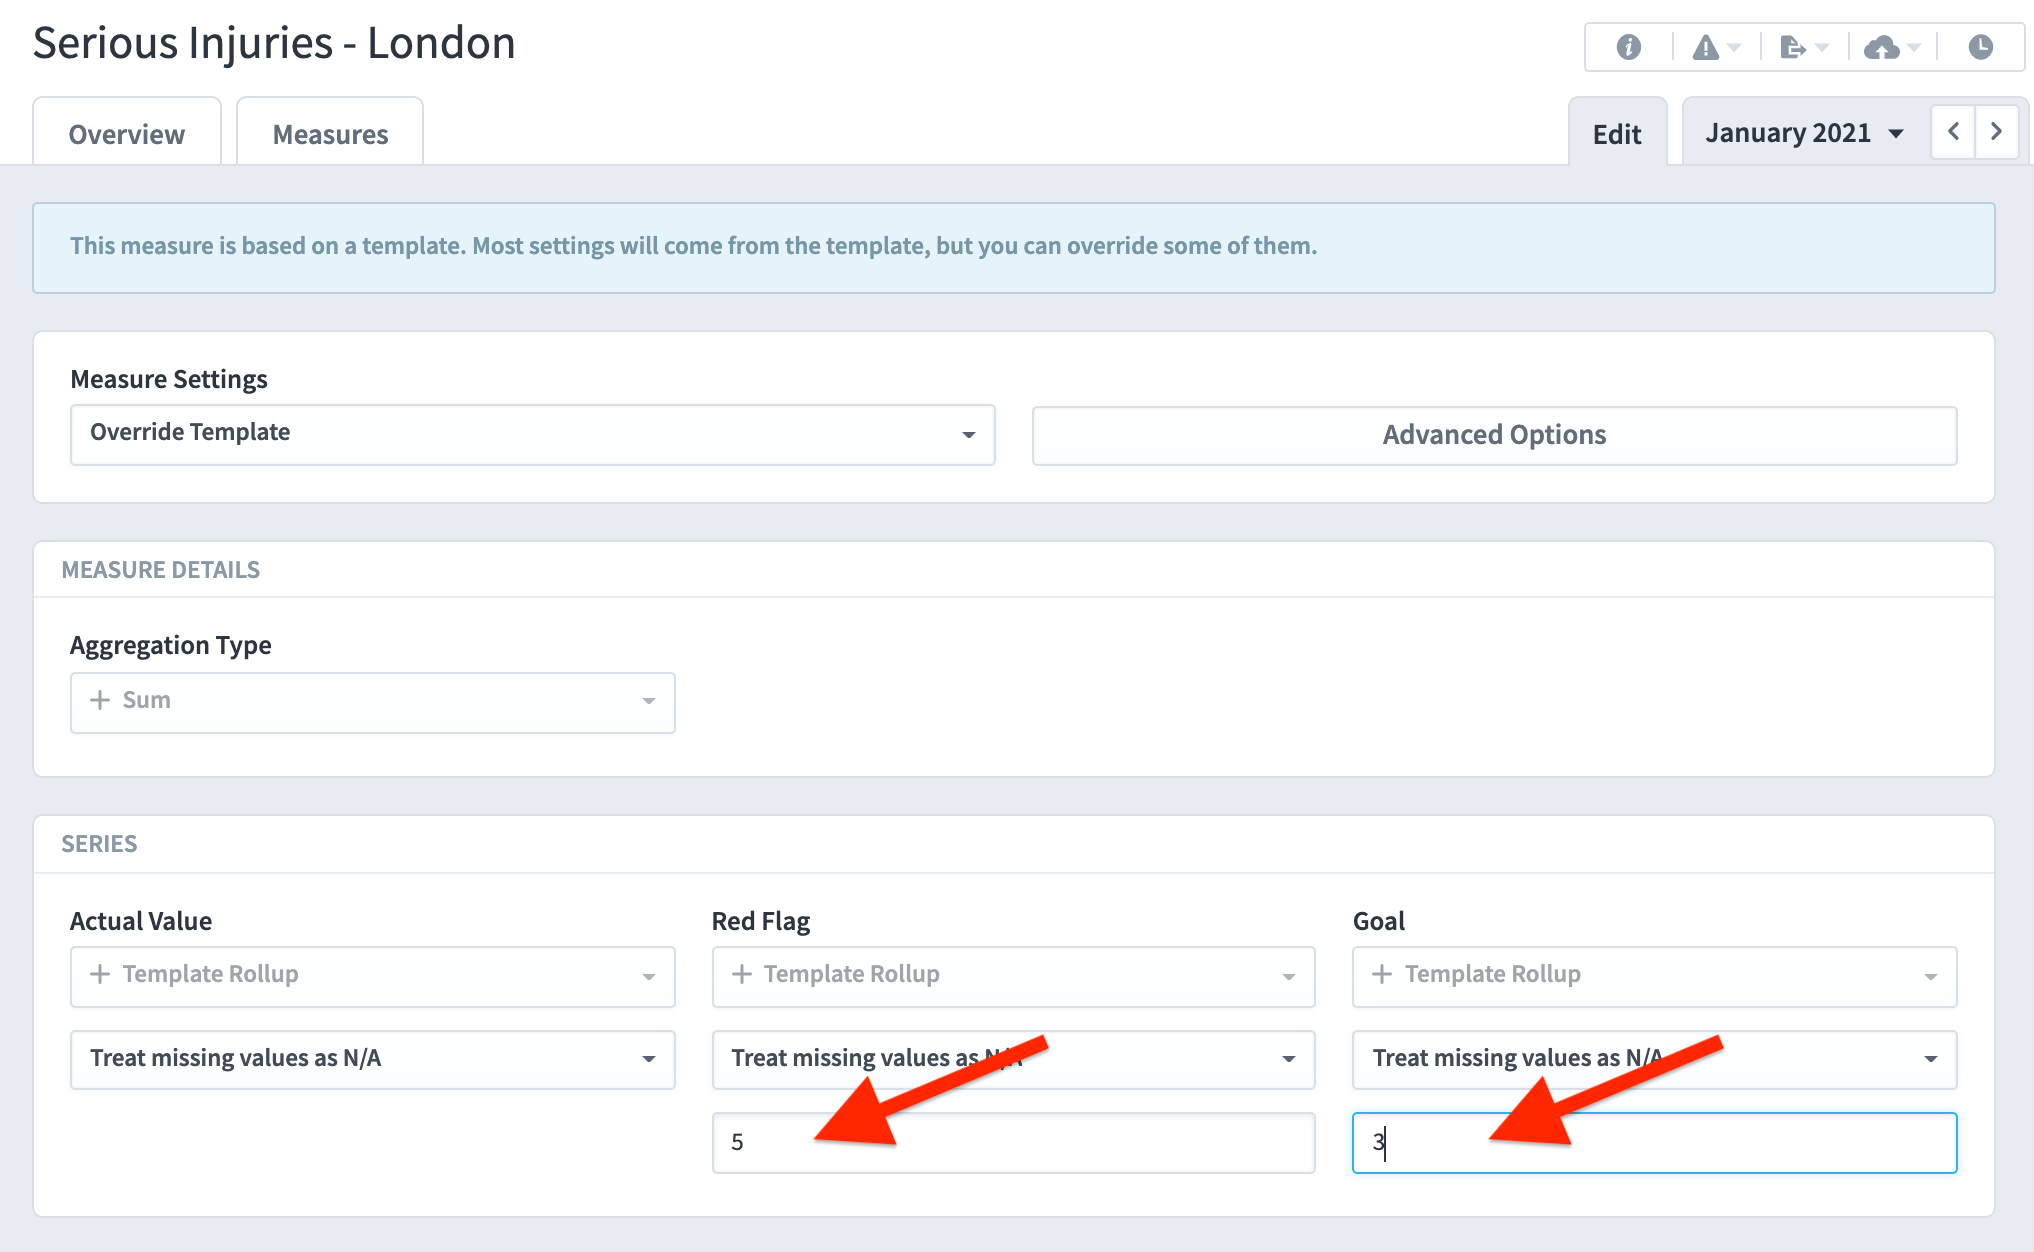
The Series box will appear, allowing you to enter local Thresholds. In our example we have added a Red Flag value of 5 and a Goal of 3:
Click Save.
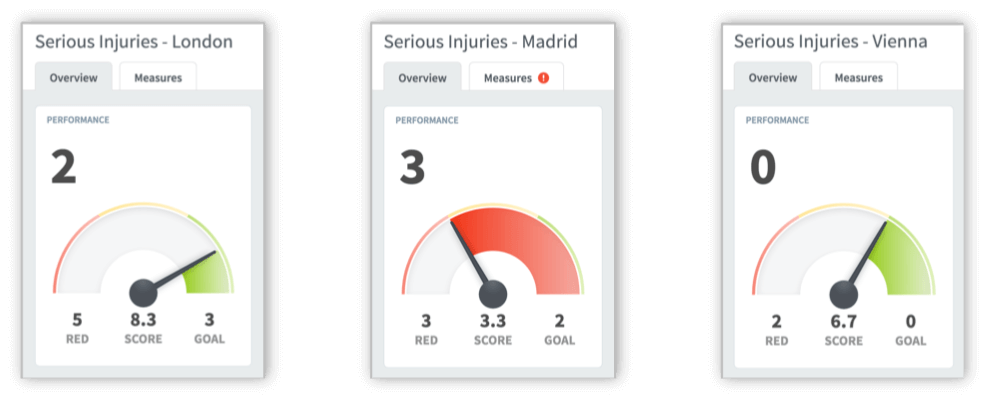
Looking at each of the lower level actual values and threshold values, we can see that they vary:
Moving to the master Scorecard, we can see that the Actual Values and Threshold Values have all been rolled up automatically:
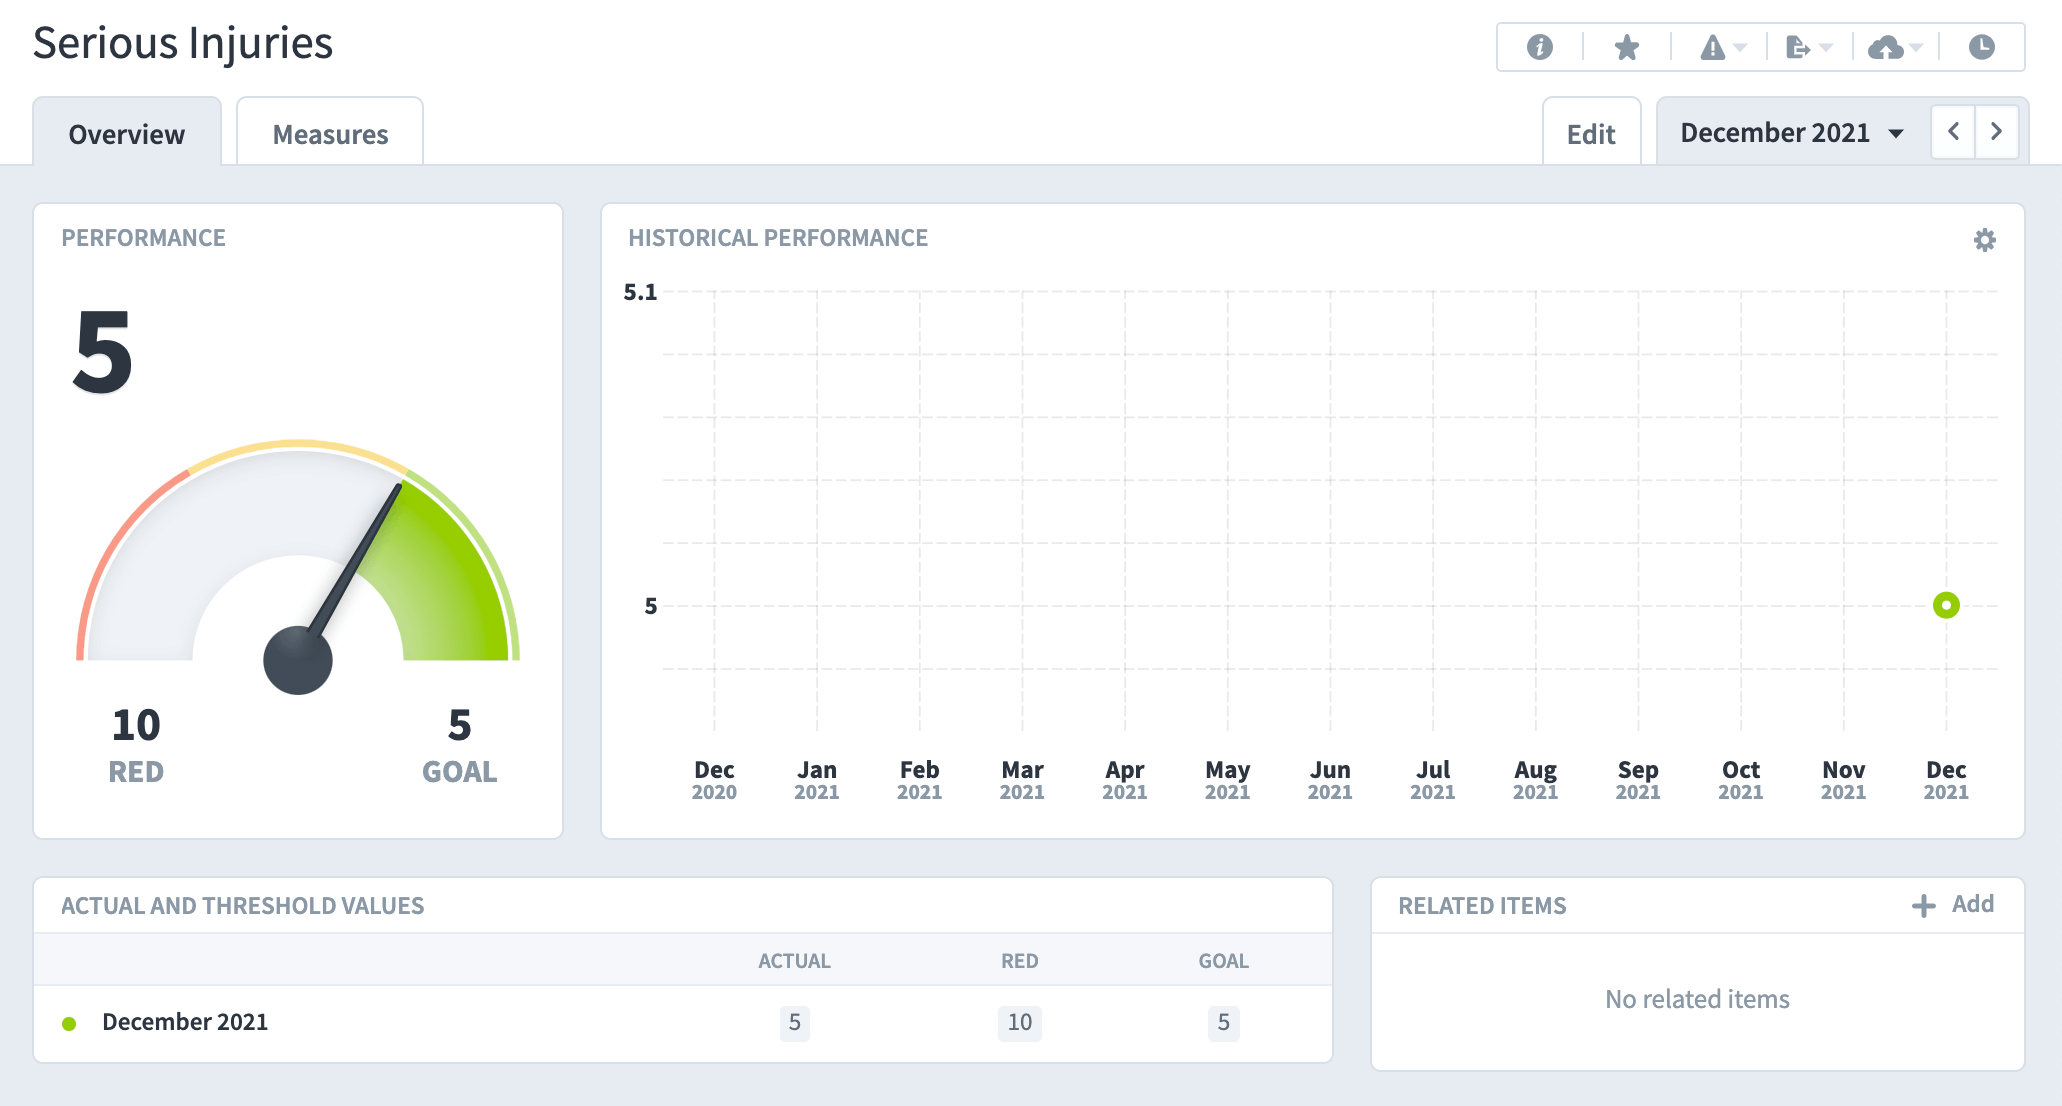
While at the master Scorecard level, click on the i button (top right) to display the information about the Measure.
The following pop-out will appear providing information about the lower level Scorecards and the calculations used in the roll up:
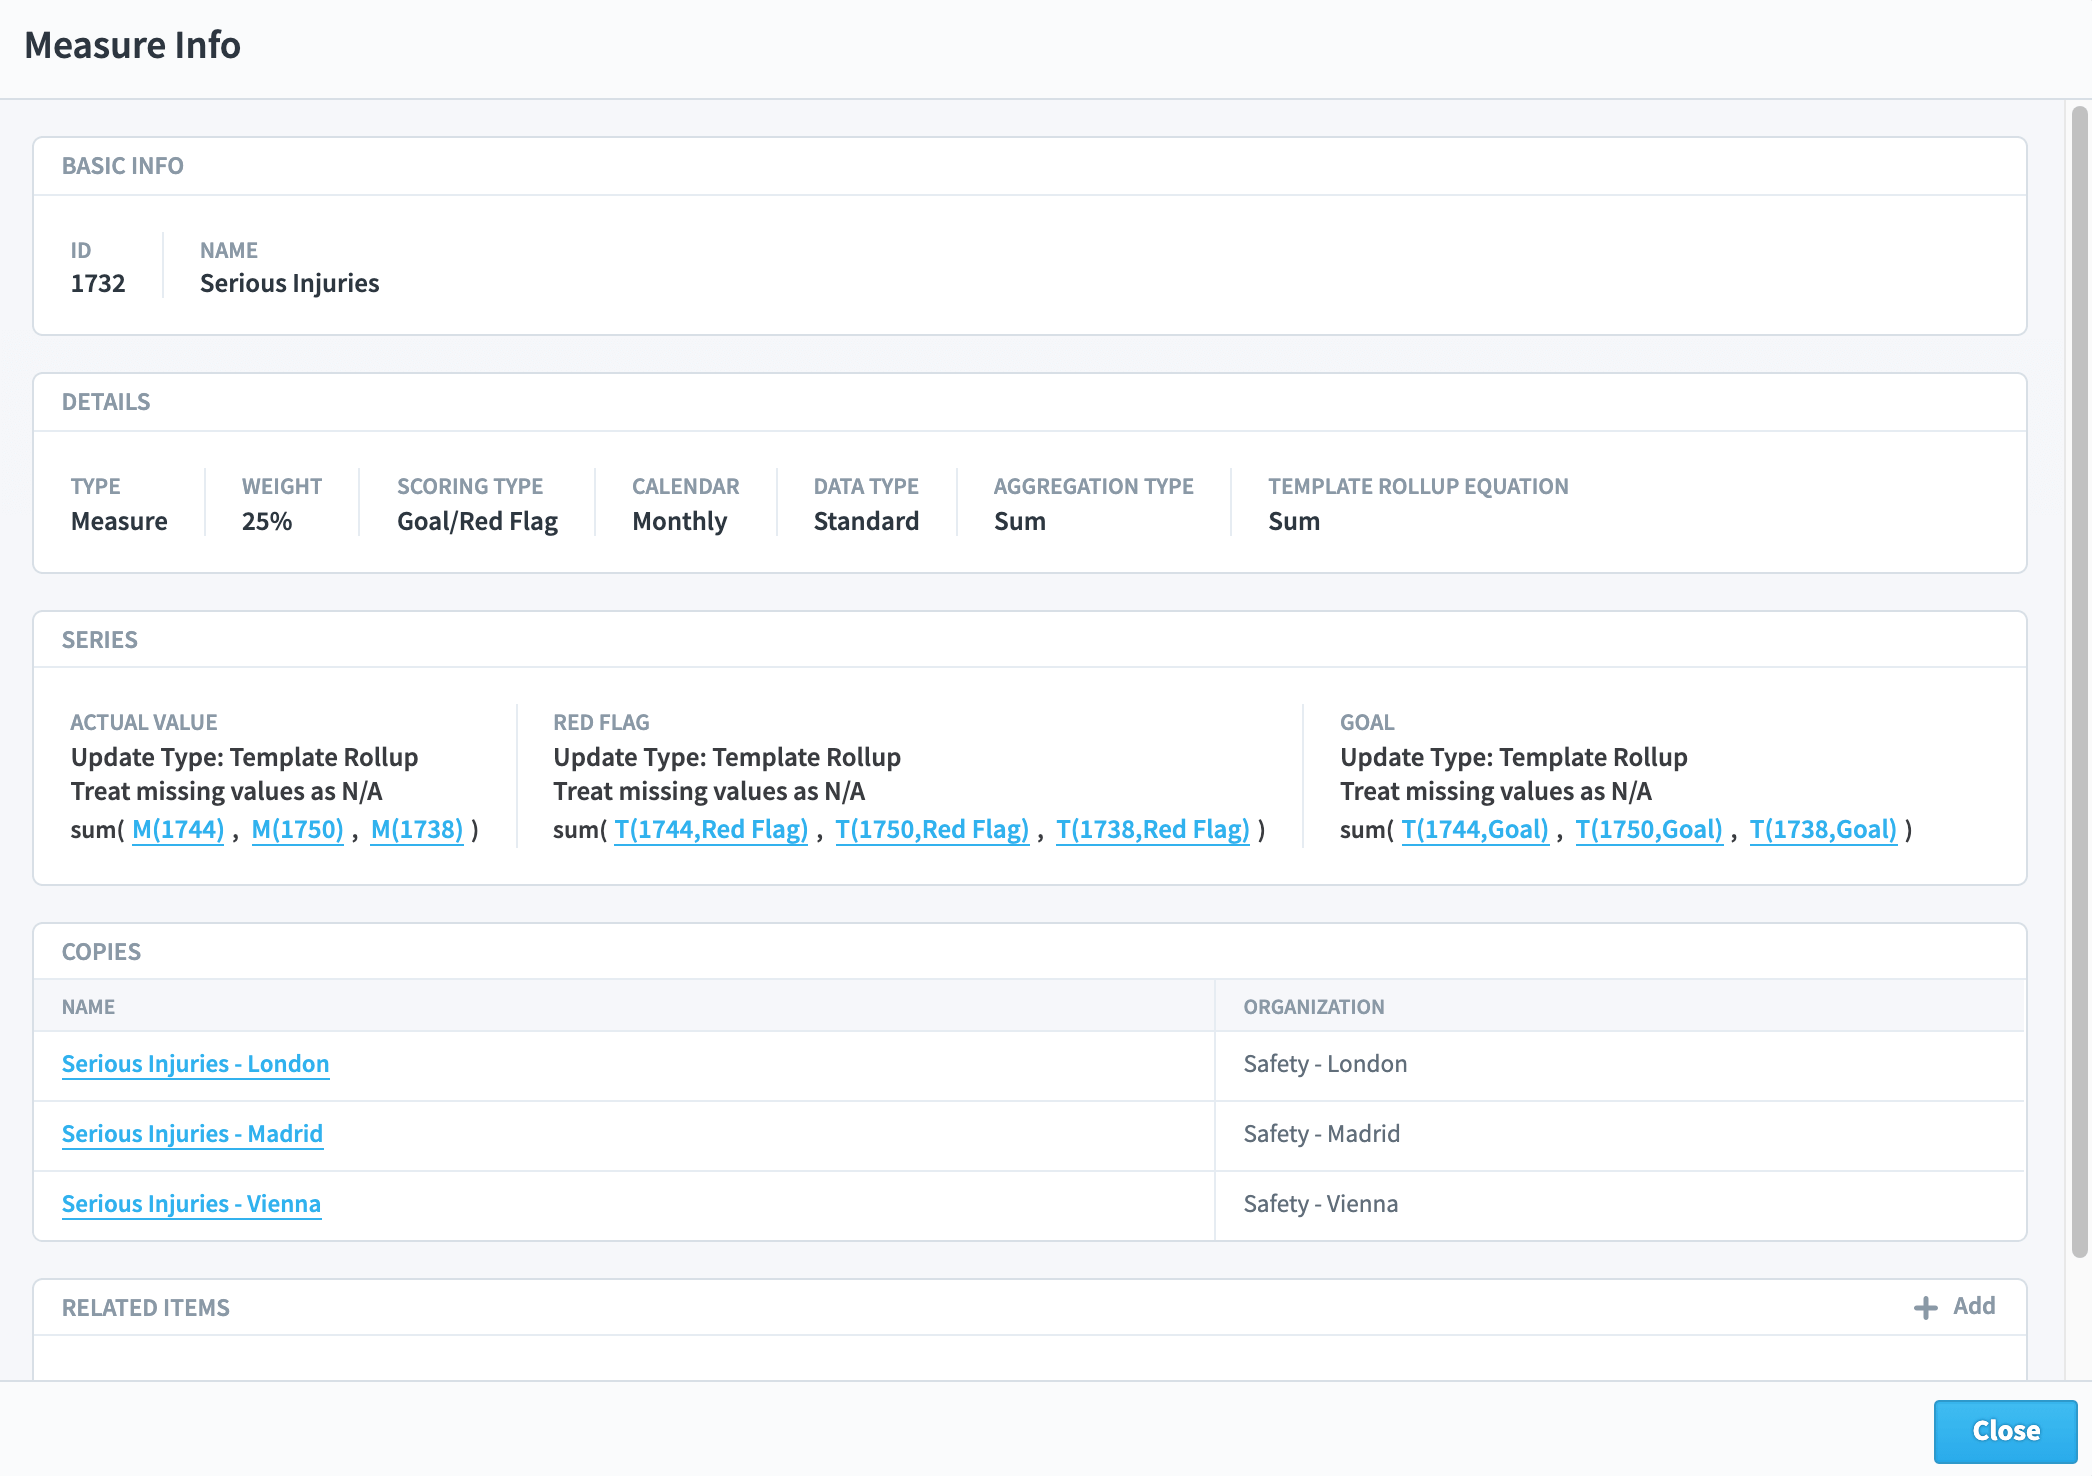
2. Actual Values as a calculation and Thresholds set at the master level.
Go to the master Scorecard and click on the Measure. In this example we are using Safety Incident Ratio.
Click on Edit at the top right of the screen.
The Measure is a percentage so we do not want to roll up all of the percentages from the lower levels. The Measure Actual Value is calculated so needs to be calculated at all levels.
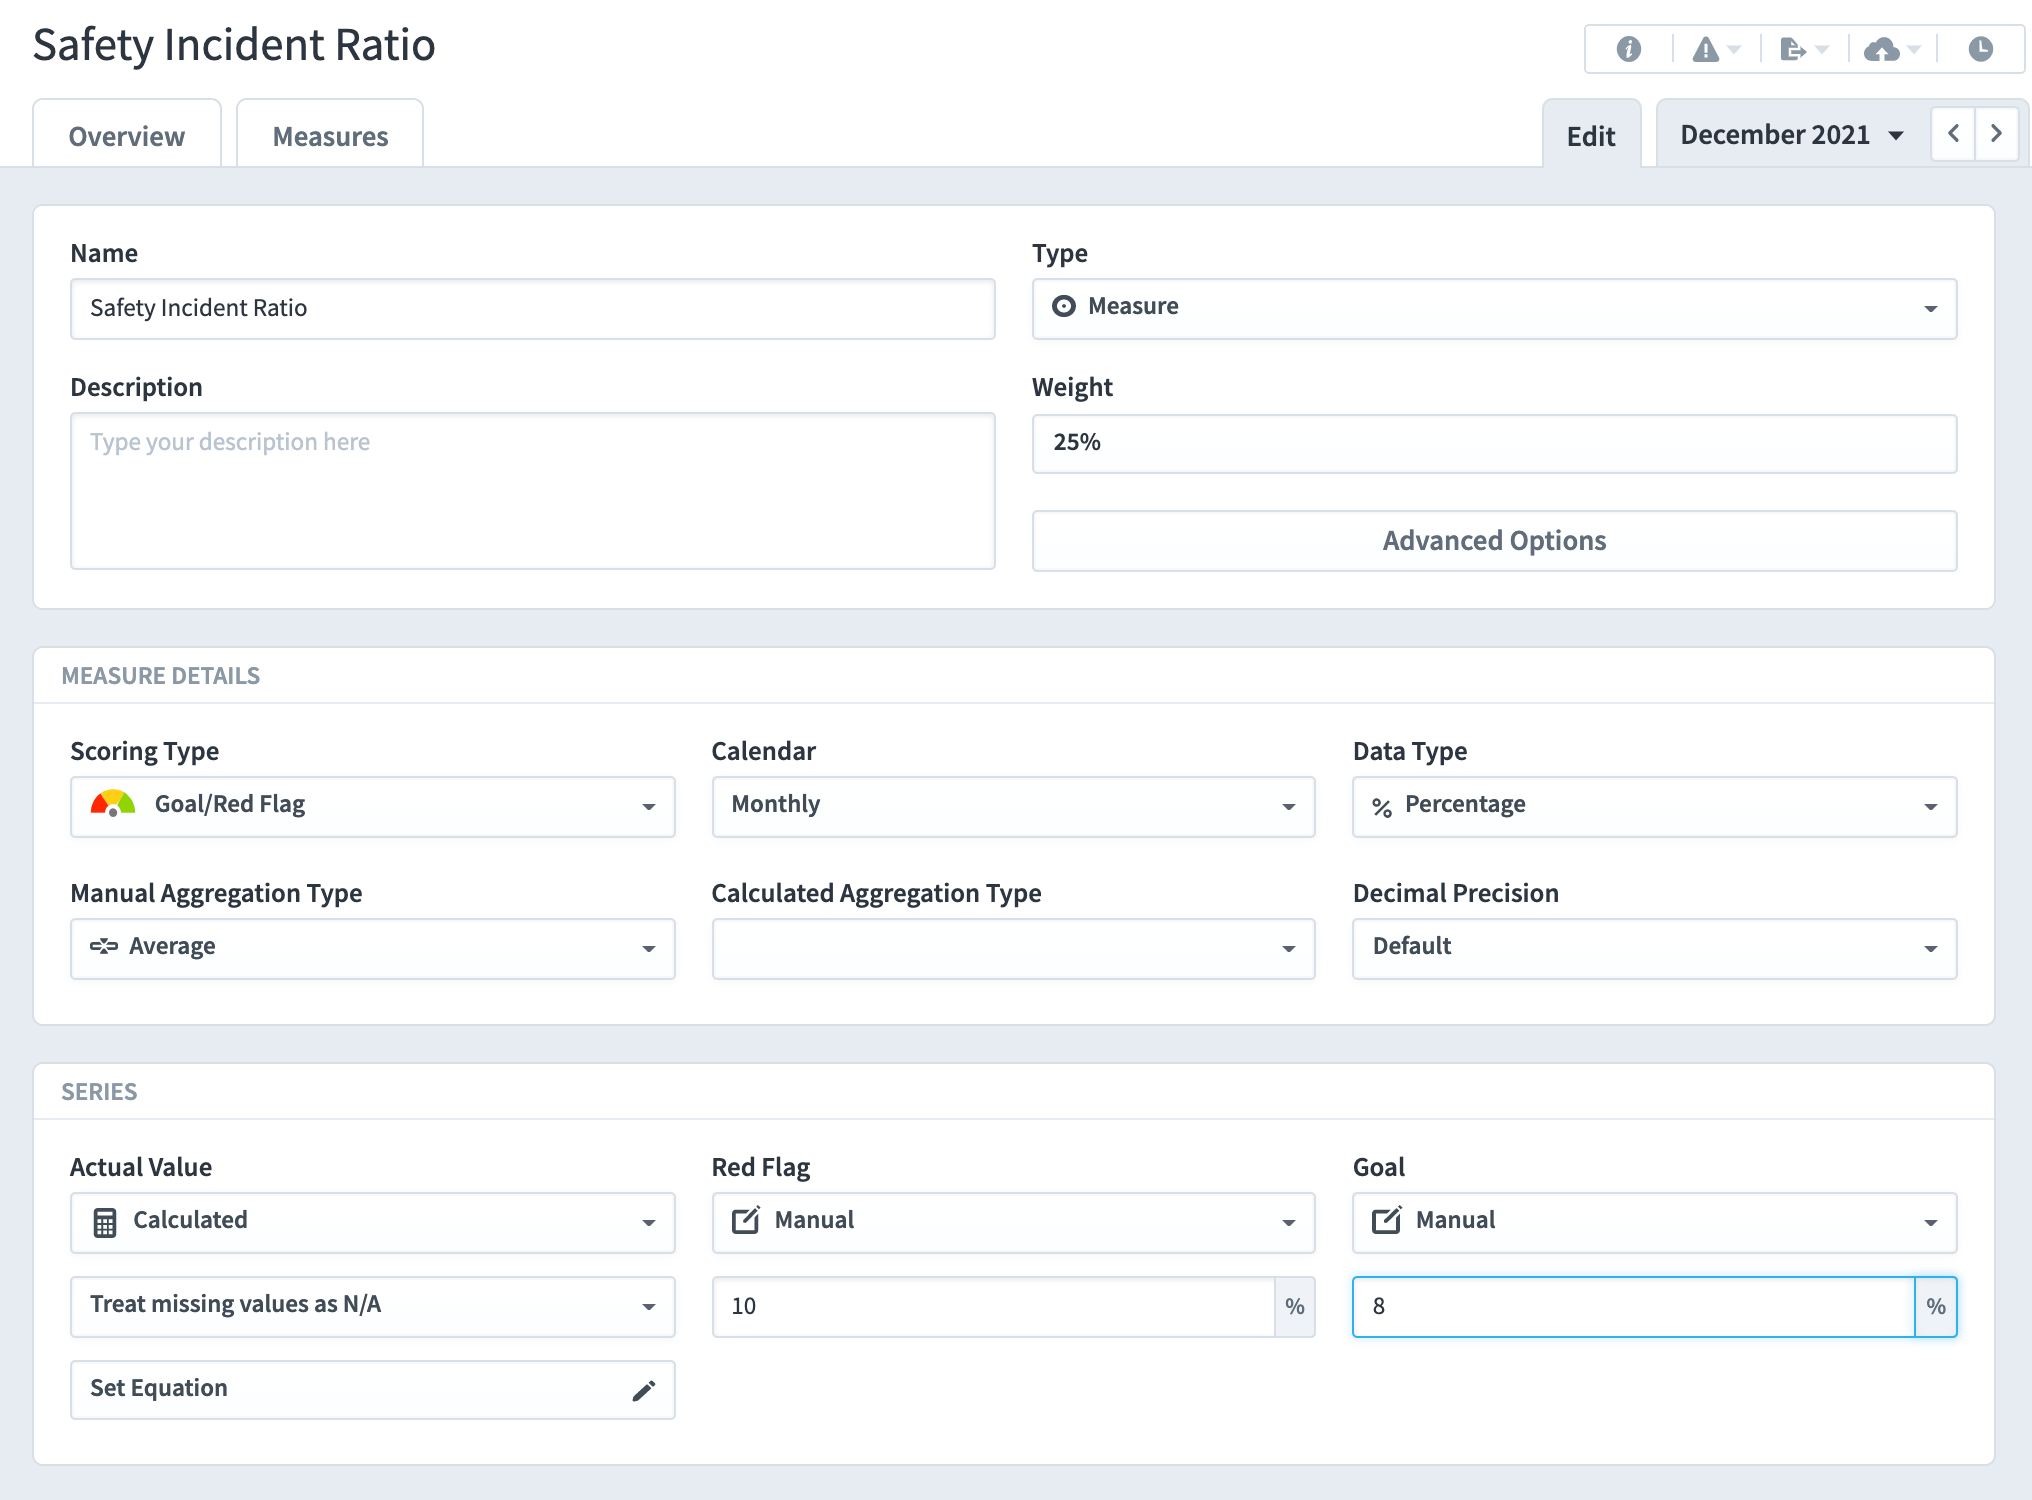
The calculation for the Actual Value is set in the Series box under Actual Value. To ensure this is calculated correctly across all calendars, set the Calculated Aggregation Type to Use Equation.
The Red Flag and Goal parameters are set in the master and will automatically cascade to the lower levels.
No further changes are required at the lower levels other than to add the Actual Values.
