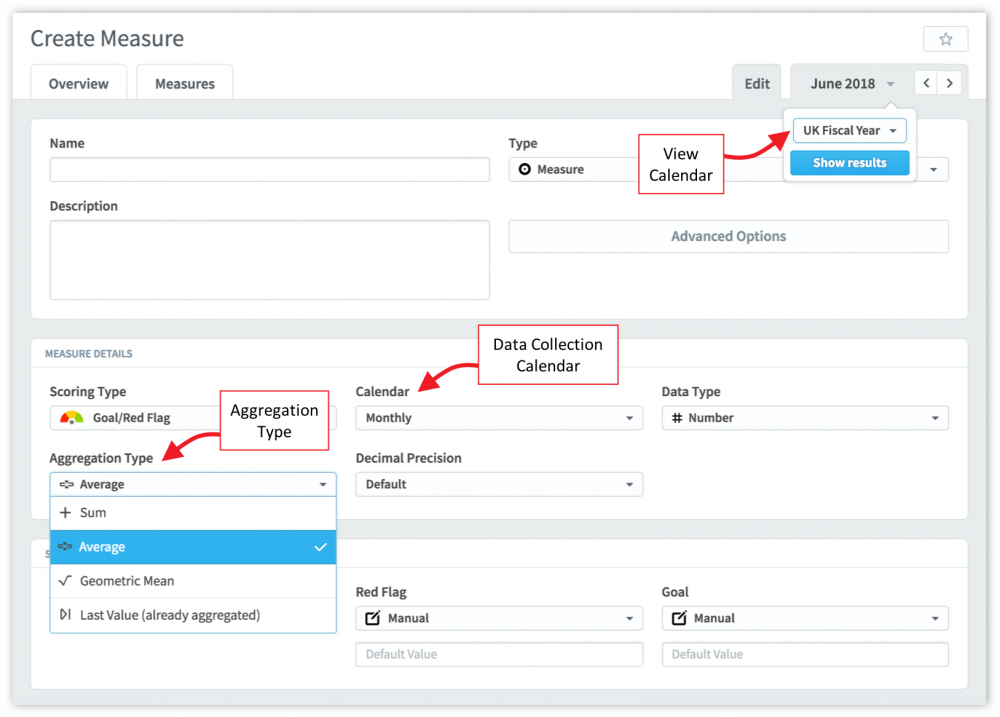
Aggregation Type is a parameter that is set while creating a KPI/Measure. It determines what happens to data when viewed using different calendars.
Your KPIs/Measures/Dashboards etc. can be viewed using the standard default calendar (usually monthly) or by changing the date range using the date selector to the top right of the screen. For example, you can select a Quarterly or Yearly range. You can also define a custom range, for example, UK Fiscal, and select that.
If you select a range that is greater than the default range, for example, if you add data Monthly and then select a Quarterly calendar, the application needs to be told what to do with the data.
Let’s look at an example, we will use the KPI/Measure Revenue
Typically, Revenue is updated every month. A discrete monthly figure could be added or a cumulative figure could be added. So the data, Monthly and Quarterly might look like this:
As you can see, when looking at the same Monthly data using a Quarterly calendar view, in the first line the Jan, Feb, Mar values have been added to provide a Quarterly total. In the second line, because the data is cumulative (that is, it has been added together already) the value (107,300) remains the same.
The application has to be told what to do with the data when viewed with a different calendar
In most cases, the application will make the right choice for you, but this needs to be checked.
In summary, the Aggregation Type needs to be set to ensure that application Sums, Averages or takes the Last Value when the data is viewed using a longer calendar length than the one used for data entry.

Aggregation type has four possible values:
- Sum – Values added monthly will be summed up when viewed quarterly or yearly e.g. Revenue is usually defined as sum.
- Average – Values added monthly will be averaged when viewed quarterly or yearly – e.g. % Customer Satisfaction is usually averaged.
- Geometric Mean – This is a special aggregation often used by statisticians to deal with large variances, see below for more details.
- Last Value – For values added monthly, the last value added will be used when viewed quarterly or yearly – e.g. Cumulative Sales is usually set to last value.
Geometric Mean
The geometric mean is a special way of calculating the average of multiple numbers used in various statistical models. The technical definition of geometric mean is: The nth root of a product of n numbers.
In practice, the mathematics is fairly simple. With the “average” aggregation type, three numbers are aggregated using (a + b + c) ⁄ 3. For geometric mean, the equation is ⁿ√(a ∗ b ∗ c).
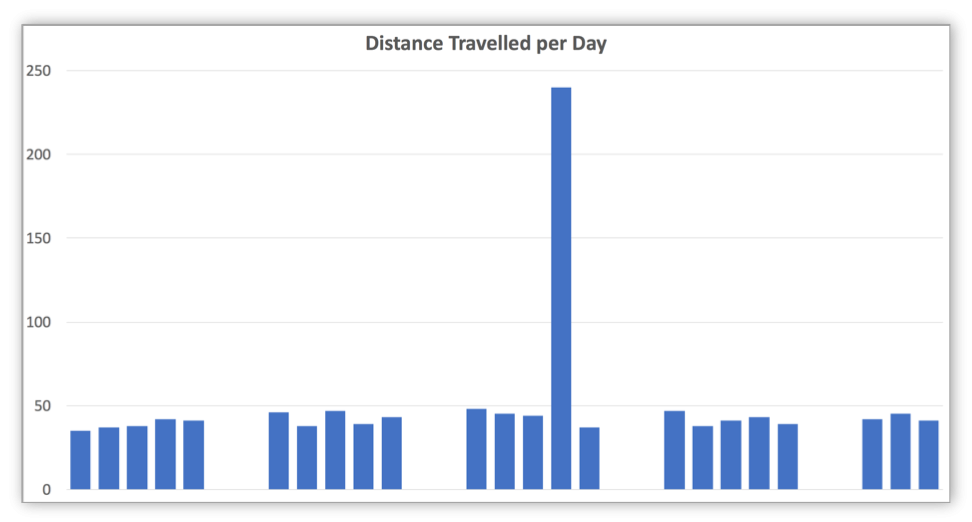
A geometric Mean is often used to deal with cases where there may be ’outliers’ that skew the data artificially.
For example; let’s say you want to know the “Average number of miles travelled per day” by a truck driver that usually delivers locally. Typically you would record the number of miles per day over a period of one month and divide by the number of ‘driver days’ to give an average.


