KPI Report
What is a KPI report? – How do I know if my business is succeeding? Depending on the sector you’re in, the numbers that tell your company’s story might be its profit margin, or how much it has to spend on advertising to gain one new customer, or how many times defects are reported in the product it manufactures. These are all key performance indicators, or KPIs.
These types of measures look at performance across the organisation, not the way individual members of the team are doing. Businesses produce huge amounts of information, so it is vitally important to select the KEY measures to report on. KPIs look at strategic elements that can track how well organisations are moving towards core goals.
A KPI needs to be something that can be counted. This requires hard outcome and numbers that can be compared over time. For example, this could be the amount sales have increased over the lifetime of an advertising campaign, not the length of the campaign itself. Essentially, a KPI looks for evidence about how well a strategic goal – like increasing sales – is being achieved over a specific period.
What is a KPI report?
The way you choose to collect and present the information in these measures is the art of KPI management. KPI reporting might seem daunting but it can actually be quite straightforward to approach. Our free eBook, titled How to Develop Meaningful KPIs, has lots of information on how to create clear objectives and goals. These, in turn, will guide and instruct you in how to design meaningful KPIs.
Good KPI reports help an operation’s management team to quickly get concise, up-to-date and accurate information about their business. An excellent report will include some, or all, of the following points about the company’s goals:
The objective: This helps clarify exactly why the information is being collected and the extent of the insight that the information offers. The objective might be “increase sales in a new (specified) market.”
The measure being used: This is essentially the KPI. As explained above, this needs to be based on hard numbers and provide some evidence of the success of the objective. This could be “how many sales were completed in (specified) new market in the last three months.”
The rationale for the measure: We already mentioned just how many KPIs that might be available to a business. This part of a KPI report explains why that particular measure is the most useful. For example, why have you chosen to track an increase in sales instead of the number of new customers? Both figures are interesting to management teams but your rationale should explain why you think an increase in sales is the best evidence of success towards the objective.
The owner and source of this data: Different members of the management team will be responsible for different pieces of information. At the same time, the data behind the measure might come from inside the company (such as sales increases) or externally (such as total profits earned by all companies in that sector). This means that each KPI will be “owned” by a different person. An HR manager could tell you how many people applied for a job in a certain area, but nothing about the sales. The right person needs to hold responsibility for the report’s data. This person should also offer their comments on what the KPI shows.
How often the data will be reported: Some data needs looking at regularly to amend strategy, other measures can be looked at over the longer term. Sales strategies, for example, may be considered by season but recruitment numbers could be looked at annually. This part of the report will state when the next examination will be.
How the data is visualised: Most KPI reports include graphs that try to show how the data compares to projections or previous measures. This should be the same type of chart each time so the comparisons are useful.
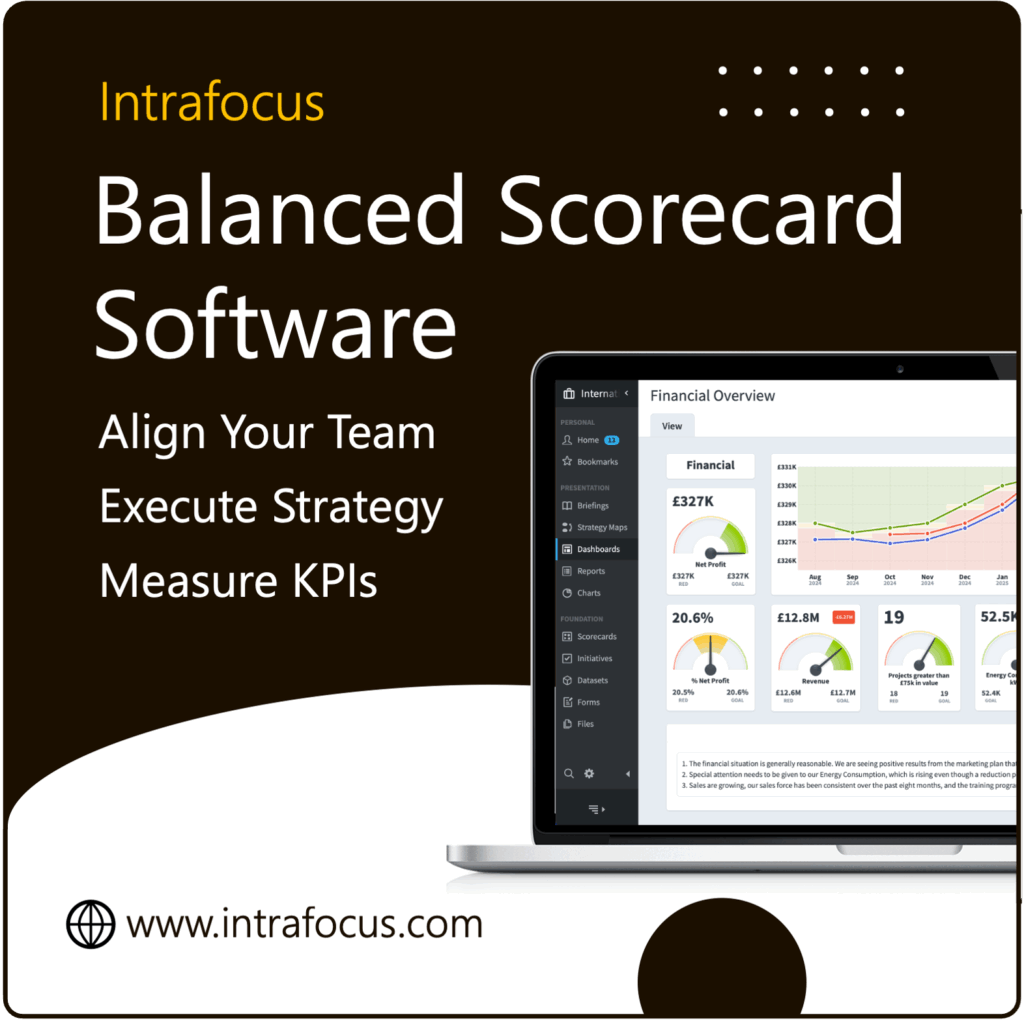
In today’s competitive environment is is just not good enough to create these reports using PowerPoint presentations and Excel data. There are a number of dedicated business performance management solutions available. One of the most advanced and intuitive KPI software solutions is Scoreboard (we would say that, but we have the customers and evidence to back up the claim!). Whatever solution you try, be sure you are provided with a free trial first.
End of KPI Reports


