The Power of Consistency
We all have routines we rely on, whether it’s your perfectly timed morning coffee or binge-watching your favourite TV series on a Sunday afternoon. There’s something comforting about knowing what’s coming next—no surprises, no guesswork, just smooth sailing. Business reporting, believe it or not, works the same way. Businesses need the same level of predictability and structure when making critical decisions. And that’s where consistency in reporting becomes the unsung hero of success.
Imagine running a company where you get a detailed breakdown of sales performance one month, and the next month, you receive a vague report filled with colourful charts but no real insights. It’s like walking into your favourite coffee shop and ordering a latte, only to be handed a cup of hot chocolate instead. Sure, hot chocolate is great—but it’s not what you came for, and it doesn’t help your caffeine needs!
Consistent, repeatable reporting does more than keep things organised. It allows business leaders to make decisions based on reliable data they can trust. When everyone looks at the same metrics in the same format month after month, patterns emerge, trends become clear, and teams can focus on what matters. In short, consistency turns data into a valuable asset rather than a confusing mess.
Why Chaos in Reporting Hurts Business:
Imagine if the ingredients were randomly shuffled every time you made breakfast—sometimes you’d get pancakes, cereal, and well, who knows what! That’s precisely what it feels like when businesses deal with inconsistent reporting. Without a reliable, repeatable process, things quickly descend into chaos. One month, you have a beautifully structured report with critical metrics neatly laid out. The next, you’re left scratching your head, trying to make sense of irrelevant charts and figures. It’s the business equivalent of reaching for orange juice and getting hot sauce instead.
The problem with inconsistent reporting is that it creates confusion—and confusion in business is costly. When your team receives different types of reports every month, with no clear pattern or structure, decision-making becomes more of a guessing game than a data-driven process. Managers spend valuable time deciphering the latest report, only to realise the data they need is buried or missing. Meanwhile, opportunities are slipping, and the business risks falling behind the competition.
But the damage doesn’t stop there. Inconsistent reporting can also lead to misalignment across departments. When presented with different information, different teams may form conflicting interpretations of the business’s performance. One team could be celebrating a “great quarter,” while another is panicking over declining sales numbers, all because they’re looking at reports that don’t line up.
The solution is simple: standardise your reporting. By tracking the same key performance indicators (KPIs) in the same format month after month, everyone in the organisation stays on the same page.
The Power of Standardization
If you’ve ever tried assembling furniture from IKEA using the instruction pamphlet, you know how frustrating it can be. You’re left staring at a pile of screws and boards, unsure where to begin and wondering if you’ll ever end up with a functioning bookshelf. It’s chaos! Now, imagine if IKEA gave you different instructions each time. Impossible, right? That’s why they stick to clear, repeatable instructions for every product, ensuring that anyone can assemble their furniture (well, most of the time!). And if you’re curious, you can check out IKEA’s products.
The same concept applies to business reporting. When it comes to tracking performance, standardisation is key. Like IKEA’s reliable instruction booklets, standardised reporting ensures that everyone works from the same playbook, following the same steps to get the same results. When your reports are consistent, tracking progress, comparing data over time, and making decisions based on solid, reliable information is easier.
The phrase “what gets measured, gets managed” has become a popular mantra in the business world—and for good reason. When you track the same KPIs in the same way month after month, such as sales revenue, customer acquisition cost, or employee turnover rate, you can effectively manage performance. You can see which areas are improving, where the problems lie, and whether your business is on track to meet its goals. On the other hand, when you’re measuring different things in different ways every month, it’s like building that IKEA bookshelf without instructions—it’s a mess.
Standardised reporting also makes it easier to spot trends. For example, if you’re tracking sales performance the same way each month, you can quickly see if numbers are trending up or down and act accordingly. Without consistency, those trends might go unnoticed, leaving you blindsided by sudden shifts in performance.
Building Confidence with Consistent Data:
Imagine walking into your favourite restaurant, excited for their signature dish, only to taste completely different every time. One day, it’s perfect; the next time, it’s a flavour disaster. Would you keep coming back? Probably not. The same goes for business reporting. Just like you expect your meal to be consistently delicious, decision-makers expect data they can trust—and that trust comes from consistency.
When businesses have consistent, standardised reports, everyone from the CEO to the newest intern knows what to expect. It’s like getting that perfectly cooked burger every time—you don’t have to worry about it, you just know it’s right. Inconsistent reporting, however, is like being handed a mystery dish. You’re left wondering, “Is this the data I ordered? What am I even looking at?”
Trust in data is crucial for good decision-making. When teams receive reports that look different every month, with KPIs that shift like the weather, it’s hard to feel confident about anything. One month, the report is all about sales; the next, it’s focused on employee satisfaction—no one knows what the priority is anymore. It’s enough to make your head spin, underscoring the weight of the responsibility that comes with ensuring data trustworthiness.
And just like a restaurant that can’t keep its dishes consistent loses customers, a business that can’t deliver reliable reports will quickly lose the trust of its team. People start doubting the data, questioning its accuracy, and making decisions based on assumptions instead of facts. It’s a recipe for disaster.
But when reports are consistent, something magical happens: people start trusting the data. They know they’re looking at the same metrics, in the same format, with the same rules. That trust builds confidence, and confident teams make better decisions. It’s like showing up to your favourite restaurant and knowing that no matter what, you’re getting a great meal every time.
So, remember, consistency doesn’t just make reporting easier; it makes your team believe in the numbers they see. And when your team believes in the numbers, they’re more likely to act on them, creating a culture of trust and informed decision-making. Consistency in data, much like in dining, keeps everyone coming back for more.
Trends and Forecasting
Think of reporting like planting a garden. Suppose you plant seeds today and check them tomorrow, expecting a full-grown tree. In that case, you’re in for disappointment (and probably some very strange looks from your neighbours). But if you check back regularly, water the plants consistently, and patiently monitor their progress, you’ll see growth and change over time. That’s how reporting works—consistency is the key to seeing trends and making accurate forecasts.
When you track the same metrics consistently over time, patterns start to emerge, and these patterns help businesses understand what’s going on. Without consistent data, it’s like trying to predict the weather by looking at just one sunny day—it will probably not end well. On the other hand, when you’ve tracked the weather for weeks, you start to see trends and can tell whether it’s time to break out the sunscreen or grab an umbrella.
In the same way, consistent reporting helps businesses recognise trends in sales, customer behaviour, and performance. This is crucial for forecasting—if you don’t know where you’ve been, how can you know where you’re going? Regular, standardised reporting gives you a long-term view, allowing you to spot when things are upswing or a storm might be brewing.
Imagine if you report sales figures one month, you switch to customer satisfaction scores, and the following month, it’s all about marketing metrics. Sure, these are all useful, but without consistency, you have no way to connect the dots. It’s like throwing random ingredients into a pot and hoping for a gourmet meal—not exactly the recipe for success.
But when businesses stick to a set of core metrics, month after month, they start to see the bigger picture. Over time, you can spot seasonal trends, anticipate slow periods, and prepare for growth spurts. Consistent data is like having a crystal ball—only better because it’s based on real numbers, not a wild guess. You’ll be able to forecast confidently, knowing that the data backing your decisions is solid.
So, just like a gardener who nurtures their plants daily to see long-term growth, businesses that consistently promote their reporting practices will reap the rewards of better forecasting and smarter planning. In the long run, consistency isn’t just a reporting tool—it’s your roadmap to future success.
The Consistency Edge in Business
In a world where data is king, consistency is your crown. Businesses that embrace standardised, repeatable reporting practices gain a significant advantage—they’re not just reacting to what happened last month but actively shaping what will happen next. Organisations can make informed decisions that drive long-term success by focusing on key metrics, keeping reporting simple and consistent, and tracking performance over time.
Consistency isn’t just about making life easier (although that’s a nice bonus). It’s about building trust in your data, aligning your teams around clear goals, and giving your business the power to confidently forecast and plan for the future. The companies that understand this don’t just survive; they thrive.
Now, if you’re ready to take your business reporting to the next level, Spider Impact is a tool that can help you do that. Delivered by Intrafocus, Spider Impact simplifies your reporting by providing robust data visualisation tools, allowing you to easily manage your KPIs and ensuring your reports are consistent monthly. If you want to bring clarity and precision to your reporting practices.
Ultimately, it’s not about drowning in data; it’s about using the right data in the right way. By mastering the art of consistency, you can transform your reports from confusing chaos into a strategic asset that drives your business forward.
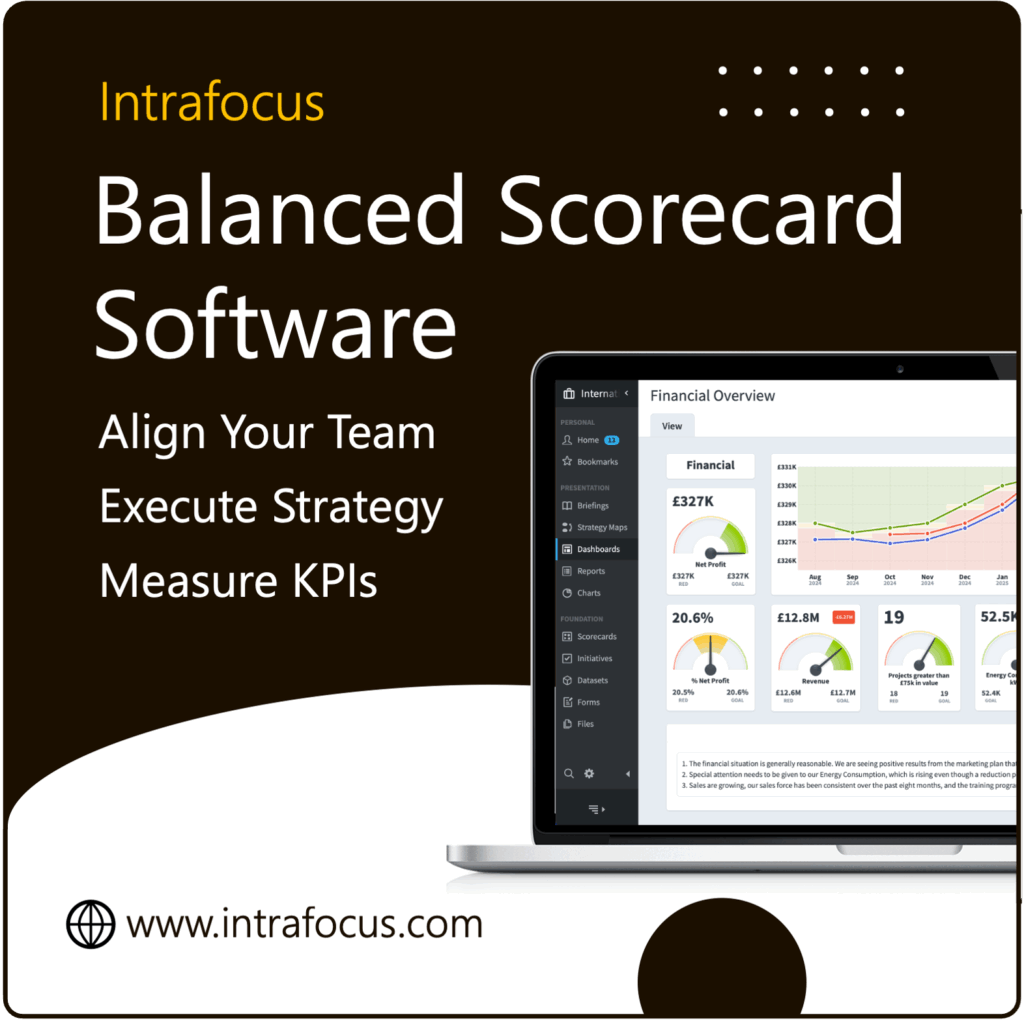
If you are implementing or thinking about implementing a Balanced Scorecard, then please take a look at out Balanced Scorecard Software, Spider Impact.