Businesses have access to more data than ever before. From sales figures and customer insights to employee performance metrics, we are bombarded with information at every turn. While this may seem a strategic advantage, it often leads to data overload. Critical insights are buried beneath a mountain of irrelevant data, and decision-makers are left guessing what matters.
Data overload creates a real risk. When businesses chase after every piece of available information, they lose focus on the metrics that drive performance and impact growth. Instead of clarity, they are left with complexity and confusion. More analysis and more colourful charts do not necessarily lead to better decision-making. It can have the opposite effect, creating delays, analysis paralysis, and even missed opportunities.
To regain control, businesses must focus on the key performance indicators (KPIs) that align with their core objectives. By focusing on what truly matters, organisations can cut through the noise, making data a powerful tool for clarity rather than confusion.
Understanding the Metrics that Matter
Not all data is created equal. The key to effective business reporting is identifying the metrics that truly matter. That will drive meaningful action and align with your company’s strategic goals. However, selecting the right KPIs isn’t always straightforward. The temptation to measure everything often leads to tracking too many metrics, diluting the focus on the ones that can make a difference.
The starting point for understanding the metrics that matter is to tie them directly to your business objectives. Ask yourself: What are the critical outcomes the business is striving for? For example, suppose your goal is to increase customer retention. In that case, metrics around customer satisfaction scores, repeat purchases, and churn rates are vital. On the other hand, tracking data like website traffic or social media impressions might be interesting but less relevant to achieving that specific goal.
Another critical element is ensuring your KPIs are both actionable and measurable. A good KPI isn’t just a number—it should prompt a decision or action. If a metric doesn’t provide insight into what your business should do next, it’s probably not worth tracking. For example, a KPI around sales conversion rates is actionable because it directly indicates where adjustments in sales processes may be needed.
Finally, you should limit the number of KPIs you track. Simplicity is vital to clarity. A handful of well-chosen metrics will give you a clear view of business performance. In contrast, an overload of metrics can obscure the big picture. By focusing on what truly matters, businesses can ensure that their reporting delivers valuable insights rather than just more noise.
Simplifying Your Reporting Framework
One of the most effective ways to cut through the noise of data overload is by simplifying your reporting framework. Instead of getting bogged down by hundreds of metrics, businesses can use a structured approach to focus on the most important ones. The Balanced Scorecard (BSC) is one of the most well-known frameworks that does just that. The Balanced Scorecard helps organisations align their performance metrics with their strategic goals across four perspectives: financial, customer, internal processes, and organisational capacity.
Why the Balanced Scorecard?
The brilliance of the Balanced Scorecard lies in its ability to create a more holistic view of business performance. Rather than focusing solely on financial metrics, which traditionally dominate reporting, the BSC broadens the scope to include other critical areas that drive success. This structured approach ensures that companies aren’t just evaluating short-term financial outcomes but are also considering the drivers that influence long-term performance and sustainability.
The Balanced Scorecard forces organisations to focus on a balanced set of KPIs across different areas, ensuring they maintain a healthy overall business performance.
Defining Key Metrics for Each Perspective
- Financial Perspective: This is the traditional reporting area and includes key metrics such as revenue growth, profit margins, cost reductions, and return on investment. While these are essential for understanding the bottom line, relying on financial metrics alone can provide an incomplete picture of performance.
- Customer Perspective: The next perspective focuses on customer satisfaction, retention, and acquisition. Metrics might include customer satisfaction scores, Net Promoter Score (NPS), churn rates, or market share. Focusing on the customer perspective ensures that businesses aren’t just meeting financial goals but also delivering value to their customers.
- Internal Processes: This perspective addresses how efficiently the business operates internally. Key metrics in this area might include production efficiency, cycle times, and quality assurance. Streamlining processes can often lead to cost savings and better customer outcomes, making this perspective vital for operational improvement.
- Organisational Capacity: The final perspective is often overlooked but critical for long-term success. This includes metrics around employee development, innovation, and corporate culture IT and infrastructure. By focusing on organisational capacity, businesses can ensure they have the capabilities and culture to sustain long-term performance. Metrics might include employee engagement scores, training completion rates, or innovation pipelines.
Using the Balanced Scorecard
The Balanced Scorecard forces companies to focus on the key performance drivers across these four perspectives. This not only reduces data overload but also creates consistency. Leaders know what to expect monthly—they can consistently compare their performance across the four perspectives.
By narrowing the focus to a few KPIs in each perspective, businesses can generate reports that are clear, actionable, and aligned with strategic goals. For example, a company might decide to track just three to five critical metrics per perspective rather than dozens of unrelated metrics. This structured approach ensures that reporting delivers real value, providing insights that managers can act on.
The Balanced Scorecard in Action
To see the Balanced Scorecard in action, imagine a company that focuses on four primary KPIs: revenue growth (financial), customer retention rate (customer), production efficiency (internal processes), and employee satisfaction (organisational capacity). They track these metrics monthly to assess whether their performance is aligned with long-term strategic goals. If revenue is up but employee satisfaction is down, this signals a potential future problem. The Balanced Scorecard allows leaders to spot these imbalances early before issues compound.
By leveraging the BSC’s simplicity and balanced approach, businesses can shift from reactive to active decision-making. Instead of responding only to financial reports or last-minute data crunches, leaders can fully view their organisation’s health and make informed, balanced decisions that drive sustainable success.
The Dangers of Ever-Changing KPIs
It’s tempting to constantly adjust Key Performance Indicators (KPIs) in response to new trends, opportunities, or challenges. While agility is essential, constantly changing KPIs can create more harm than good. Frequent changes disrupt the consistency needed to track performance over time, leaving managers unable to identify meaningful trends or understand long-term impacts.
One significant danger of ever-changing KPIs is losing focus. When businesses switch from one set of metrics to another too frequently, it becomes difficult to determine what success really looks like. A KPI needs time to be measured, analysed, and acted upon. If it’s swapped out too soon, the organisation never fully commits to a course of action, and performance becomes fragmented. Decision-makers are left guessing, and the business risks becoming reactive rather than strategic.
Another issue with inconsistent KPIs is that they can undermine accountability. When metrics constantly change, it’s difficult for teams to take ownership of their results. Employees may feel like they are chasing a moving target, which diminishes engagement and can lead to confusion about priorities. Stability in KPIs allows managers and employees alike to understand expectations and drive results toward specific objectives.
Finally, frequent KPI changes can erode trust in data. When key stakeholders are presented with a new set of metrics each month, they may begin to question the reliability or importance of any of them. This leads to scepticism about the value of reporting and can weaken buy-in from the team. Consistent KPIs, on the other hand, provide a clear and transparent view of performance, helping to build trust in the data and the decisions that follow.
Setting KPIs that are stable and aligned with long-term goals is essential to avoid these dangers. By resisting the temptation to constantly switch metrics, businesses can track meaningful trends over time, ensure accountability, and create a reliable foundation for decision-making.
Visualising Data for Actionable Insights with Spider Impact
The power of data lies not just in its collection but in how it’s presented. Data visualisation transforms complex data sets into clear, actionable insights, helping decision-makers understand the story behind the numbers. However, not all visualisations are created equal. Overly complex charts or inconsistent formats can create confusion rather than clarity. That’s where tools like Spider Impact come into play, offering a simple yet powerful way to visualise performance metrics.
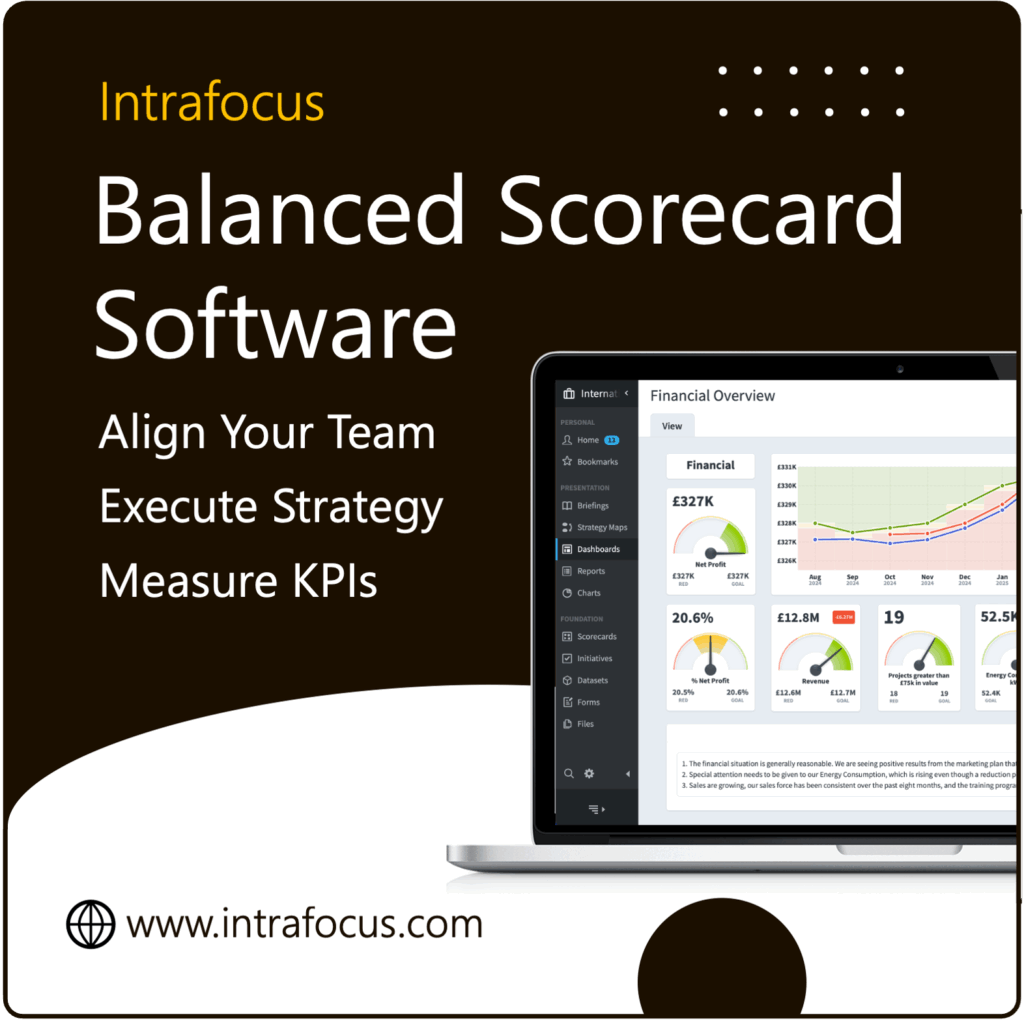
Spider Impact is a business performance software designed to bring data to life through intuitive dashboards, easy-to-read graphs, and clear visual cues. One of its greatest strengths is its ability to turn raw data into visual reports that are both informative and engaging. The tool integrates with Balanced Scorecard frameworks and enables businesses to track KPIs using colour-coded indicators like red, amber, and green to highlight performance levels.
The advantage of using Spider Impact is its ability to present data consistently and standardise it monthly. For example, rather than reinventing charts and graphs for each reporting cycle, Spider Impact allows you to set up customised dashboards that automatically update with the latest data. This saves time and ensures that key stakeholders look at the same metrics in the same format, making trends and anomalies easy to spot.
Moreover, Spider Impact excels in visual simplicity—a critical aspect of effective reporting. Instead of overwhelming managers with data-heavy reports, the software presents performance data concisely and visually impactfully. Whether tracking financial KPIs, customer satisfaction, or internal processes, Spider Impact helps users see where attention is needed and where the business thrives.
In short, businesses can create visual reports that drive action by leveraging a tool like Spider Impact. The clarity and consistency it offers in presenting KPIs enable quicker decision-making and more focused performance reviews, ensuring managers spend less time deciphering and acting on data.
Clarity is the New Competitive Advantage
The ability to cut through the noise and focus on what truly matters has become a critical competitive advantage. Data overload can paralyse decision-making, but businesses that simplify their reporting frameworks and focus on clear, consistent metrics can act confidently and quickly. Companies can transform overwhelming data into actionable insights by narrowing their attention to the right KPIs, visualising them effectively through tools like Spider Impact, and adhering to frameworks like the Balanced Scorecard.
Clarity in reporting is no longer just a nice-to-have; it’s a business imperative. Those who master focused, consistent reporting will make smarter decisions, align teams more effectively, and drive long-term success. Ultimately, clarity in data isn’t just about reporting—it’s about enabling your business to move forward with purpose and precision.
If you are implementing or thinking about implementing a Balanced Scorecard, then please take a look at out Balanced Scorecard Software, Spider Impact.


